Exploring HLA-DQA & HLA-DQB Polymorphisms in Local Population of Pakistan
Faiza Quddus[1]*, Sayyeda Saba Batool[2]
|
KEYWORDS Human leukocyte antigen, HLA polymorphism, genetic diversity, HLA-DQA1, HLA-DQB1, allelic frequency |
|
Abstract Human leukocyte antigens (HLA) are pivotal in immune regulation, crucial in organ transplants. Allelic frequencies at HLA-DQA1 and HLA-DQB1 were compared across age, gender, patient/donor status, blood group, cities, and ethnicity in 100 participants. DNA extracted from blood samples underwent quantification, hybridization, and sequence-specific oligonucleotide (SSO) typing. Match IT DNA software analyzed SSO typing, and statistical tools including Student's T-test and Analysis of Variance (ANOVA) assessed data, utilizing GraphPad Prism 6 and Microsoft Excel. Findings revealed varying allele frequencies across parameters. Locally, DQA106 and DQB104 were less common, contrasting with DQA101 and DQB103 prevalence. Among ethnic groups, Punjabis showed higher DQA101 frequency, while DQB1 alleles were less common. Regarding blood groups, DQA101/02/05/06 and DQB102/04/05 were prominent in O+ individuals, with DQA103 and DQB103 in B+ individuals. Males displayed higher DQA106 and DQB103 prevalence than females. Across age groups, DQA1 dominance was observed in age group II compared to DQB1 alleles. DQB101 and DQA1*03 were more frequent in donors than patients. Due to balancing selection, DQA1 had the highest allelic frequency, while DQB1 had the lowest. This study offers valuable insights into HLA II loci allele frequencies, aiding in understanding the Pakistani population's immunogenetic landscape. |
INTRODUCTION
Human leukocyte antigens (HLA) are the genes responsible for encoding proteins that play a critical role in distinguishing self from nonself antigens [1,2]. The discovery of HLA genes can be traced back to observations of skin graft rejection in genetically incompatible mouse strains [3]. These HLA genes are situated on chromosome 6 within the genomic region known as the major histocompatibility complex, which is highly polymorphic [4]. HLA is categorized into three classes based on the different structures and functions of these genes [5,6]. Class I HLA antigens encompass HLA A, B, and C, while class II includes HLA-DR, DQ, and DP [7]. Class III of HLA contains genes responsible for immune functions, including hormones, complement components, and intracellular peptide processing [8]. Each individual possesses a unique set of HLA antigens, with half inherited from the mother and the other half from the father [9]. This uniqueness is crucial in kidney transplants, where HLA antigen matching is of utmost importance for a successful procedure [10,11]. HLA typing is employed to identify specific HLA antigens and is also valuable for predicting, diagnosing, and preventing diseases. Additionally, the HLA system can provide insights into the origins, evolution, and migration patterns of human populations. HLA data aids in distinguishing between diseased and healthy individuals [3].
Various techniques are utilized for HLA antigen typing, including serological methods. This encompasses cell-based assays, followed by the discovery of the complement-dependent microlymphocytotoxicity (CDC) method, which measures antigen expression levels [12]. Besides CDC, other techniques like mixed lymphocyte culture (MLC) and primary lymphocyte culture (PLC) have been employed [13]. These methods, while time-consuming, are used in the selection of donors for hematopoietic stem cell transplantation. DNA-based methods are also prevalent for HLA typing. Among them, three PCR-based methods-sequence-specific primer amplification (SSP), sequence-specific oligonucleotide probe hybridization (SSOPH), and sequence-based typing (SBT) - have gained prominence for their precision and ability to produce results without requiring viable cells12. PCR techniques have proven highly useful for HLA classes I and II due to their efficiency and ease of use [14].
The primary objective of this research is to investigate the association between allelic frequencies at the HLA-DQA1 and HLA-DQB1 loci in the local population of Pakistan. The study seeks to explore polymorphism and variations in allele frequencies of HLA-DQA1 and HLA-DQB1 in relation to various parameters, including blood groups, genders, ages, cities of origin, patient or donor status, and ethnic groups.
Characteristics of Population
Data on kidney transplantation donors and patients were collected, considering various parameters such as blood group, gender, age, and ethnicity. Information for a hundred donors and patients was gathered across different cities including Alipurchatta, Bahawalpur, Bbhakar, Bahwalnagar, DG Khan, Faisalabad, Gujranwala, Gujrat, Jhang, Jehlum, Kasur, Khanewal, Kuchai, Lahore, Laiyah, Muzafargarh, Nankanasahib, Narowal, Okara, Pakpatan, Parchanar, Rajanpur, Raiwind, Sahiwal, Sargodha, Sheikhupura, Sialkot, Vehari, and others. This diverse dataset was employed for locus analysis of alleles. Analysis of blood groups revealed varying percentages among the population, with A+ at 16%, B+ at 29%, O+ at 39%, AB+ at 6%, O- at 4%, B- at 2%, and A- at 1%. In terms of gender distribution, males constituted a higher percentage, at 96%, compared to females at 37%. Ethnically, the data exhibited a predominance of Punjabis at 96%, while Sariki and Pashtu ethnicities represented the lowest, at 2%. Regarding age groups, the highest percentage, 17%, was found among participants in age group II (23 to 29 years), while the lowest, 7%, was observed among individuals aged over 50 years.
Blood Extraction
Blood was collected into EDTA vials via intravenous extraction from the cubital blood vein. Blood plasma was promptly separated within 30 minutes of collection. DNA isolation from the blood was carried out using DNAzol. Initially, DNAzol was vortexed with 0.5 ml of blood. Subsequently, 0.5 ml of isopropanol was added and mixed with the lysate by vortexing, and the mixture was left to stand for 5 minutes at room temperature. The resulting precipitated DNA was then centrifuged at 6000 g for 6 minutes to facilitate sedimentation.
For lysis and precipitation, an equal volume of 0.5 ml of isopropanol and DNAzol was used. Vortexing was performed to enhance the quality of the extracted DNA and to dissolve protein aggregates. The addition of 0.5 ml of DNAzol BD to the DNA pellet was carried out for washing, followed by centrifugation and removal of the supernatant. The DNA pellet was vortexed to disperse it, and the resulting mixture was again centrifuged at 6000 g for 5 minutes. The supernatant was discarded, and 75% ethanol was added for further washing of the DNA pellet, followed by another centrifugation at 6000 g for 5 minutes. Ethanol wash was removed via decanting, and the tubes were stored in a vertical position, while any remaining wash was extracted using a micropipette. Subsequently, 200 µl of 8mM NaOH was introduced to the DNA pellet without drying, and the DNA was left to solubilize at room temperature for 3-5 minutes, followed by repeated mixing through vortexing. The alkaline DNA solution was neutralized using 0.1M HEPES.
DNA Quantification
A Nanodrop spectrophotometer was employed to quantify the DNA. Initially, 1-2 µL of the DNA sample was pipetted onto the measurement pedestal. Subsequently, software analysis was conducted to obtain spectral measurements on the PC, while the sampling arm was lowered before taking the measurements. Surface tension was utilized to secure the sample in place, and a xenon flash lamp served as the light source for detection. Once all the measurements were completed, the sampling arm was raised.
DNA Amplification (PCR)
For DNA amplification, the PCR master mix was equilibrated at room temperature (18-30 ºC) and gently vortexed to ensure all salts were thoroughly mixed in the solution. Subsequently, it was microcentrifuged for 5 to 10 minutes to pellet the entire contents. Then, to reach a final volume of 20µL per reaction, nuclease-free water was added for amplification and gently vortexed. The genomic DNA from the amplified mixture was then transferred to the PCR tubes. To prevent evaporation during the PCR reaction, the tubes were tightly capped. Finally, the samples were placed in the thermal cycler. The components of the PCR reaction included master mix 6µl, genomic DNA 80ng, DNA polymerase 6µl, nuclease-free water 20µl, and Taq polymerase 0.2µl.
Hybridization
To facilitate hybridization, the probe components were dissolved in the mixture by heating the probe mixture at 55 ºC to 60 ºC for 10 to 15 minutes. Beads were thoroughly suspended by vortexing and sonication for 15 seconds. Subsequently, 15 µL of the probe mix and 5 µL of the locus-specific PCR product were mixed and placed in each well of the 96-well plate in the thermal cycler. The plates were sealed with polyethylene tape, and a silicon compression mat was placed on top of the plate before initiating the hybridization process.
Sequence-Specific Oligonucleotide (SSO)
The HLA DR gene region was initially amplified through PCR. The amplified DNA was then probed using labeled radioactive probes. These probes had DNA sequences that were complementary to the target DNA. HLA gene-specific DNA sequences were detected through probe typing.
Match IT DNA Software
SSO typing was conducted using the Match IT DNA kit. Spreadsheet programs such as Corel Quattro and Microsoft Excel were employed to open and process the CSV file for sample typing.
Statistical Analysis
Microsoft Excel and GraphPad Prism 6 were used for statistical analysis. The locus analysis of alleles was determined through the application of Student T-test and analysis of variance (ANOVA).
Comparison of Allele Frequency in different Cities
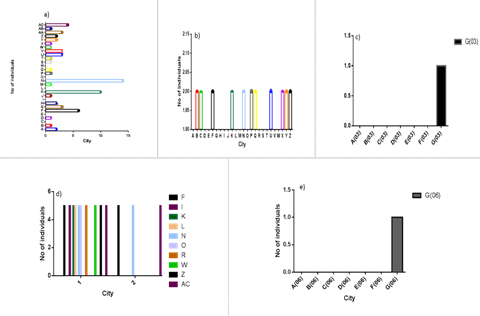
A comparison of allele 1 was conducted among participants from various cities in Pakistan, revealing variable frequency trends. Notably, the highest frequency was observed in Lahore, as depicted in Figure 1a. Conversely, for different cities, allele 2 demonstrated a similar frequency, as illustrated in Figure 1b. In contrast, a zero frequency was recorded for other cities such as Alipurchatta, Bahawalnagar, DG Khan, Gujranwala, Gujrat, Jhang, Jehlum, Khanewal, Kuchai, Laiyah, Narowal, Okara, Pakpatan, Rajanpur, and Raiwind.
In Figures 1c and 1e, alleles 3 and 6 exhibited zero frequency across all cities in Pakistan, except for Gujranwala. Figure 1d depicted the highest frequency for allele 5 in cities like Faisalabad, Jhang, Kasur, Khanewal, Lahore, Laiyah, Narowal, Raiwind, Shiekhupura, and Vehari, while a zero frequency was observed in all other cities. Therefore, HLA-DQA101/02/05 displayed the highest frequency among different cities, while HLA-DQA103/06 exhibited zero frequency in all cities of Pakistan, except for Gujranwala.
Allele 2 exhibited frequency solely in Sheikhupura, Bahawalpur, Parchanar, and Lahore, with the highest frequency observed in Lahore, as depicted in Figure 2a. In Figure 2b, the highest frequency for allele 3 was noted in Lahore, while lower frequencies were observed in Sahiwal, Parchanar, and Jehlum. Meanwhile, cities such as Vehari, Sargodha, Sialkot, Raiwind, Kasur, and Narowal displayed a similar frequency trend.
For allele 4, Okara and Lahore were the only cities to exhibit similar frequencies, as illustrated in Figure 2c. In Figure 2d, allele 5 displayed comparable high frequencies in Faisalabad and Gujrat in contrast to cities like Vehari, Muzafargarh, Pakpatan, Lahore, Gujranwala, and Kasur. Consequently, it is evident that the HLA-DQB103/05 allele is more prevalent among the local population of Pakistan, as it is present in various cities, compared to the HLA-DQB102/04 alleles, which are observed in only a few cities.
Figure 1. Allelic frequencies for locus DQA1 compared between different cities of Pakistan. (a) allele 1, (b) allele 2, (c) allele 3, (d) allele 5, (e) allele 6, A; Alipurchatta, B; Bahawalpur, C; bhakar, D; bahwalnagar, E; DG khan, F; Faisalabad, G; Gujranwala, H; Gujrat, I; Jhang, J; Jehlum, K; Kasur, L; Khanewal, M; Kuchai, N; Lahore, O; Laiyah P; Muzafargarh, Q; Nankanasahib, R; Narowal, S; Okara, T; Pakpatan, U; Parchanar, V; Rajanpur, W; Raiwind, X; Sahiwal, Y; Sargodha, Z; Sheikupura, AA; Sialkot, AB; Vehali, AC; Vehari
A Comparison of Allele Frequencies between Locus DQA1 and DQB1 was Conducted in Various Cities of Eastern Punjab, Pakistan
In Gujrat, allele 1 of locus DQA1 and allele 5 of locus DQB1 exhibited identical frequencies, while all other alleles showed zero frequency, as depicted in Figure 3. For Kasur and Lahore, HLA-DQA101 and DQB103 displayed the highest frequencies for allele 1. Kasur exhibited zero frequency for locus DQA103/04/06 and DQB101/02/04/06. Conversely, in Lahore, DQA101/02/06 and DQB101/06 had no frequency at all. In the case of Raiwind, allele 3 of locus DQB1 displayed the maximum frequency, while DQB101/02/04/05/06 exhibited zero frequency. DQA101/05 followed a similar trend, and all other alleles showed no frequency.
Sheikhupura had the highest frequency for allele 2 of locus DQB1, and a variable trend was observed for locus DQA101/02/05, with zero frequency for the other alleles. Sialkot showed frequency only for alleles DQA101 and DQB1*03, with zero frequency for all other alleles. Hence, a variable trend in allele frequencies across different cities was observed for loci DQA1 and DQB1.

Figure 2: Allelic frequencies for locus DQB1 compared between different cities of Pakistan (a); allele 2, (b); allele 3, (c); allele 4, (d); allele 5. (A; AlipurChatta, B; Bahawalpur, C; Bhakar, D; Bhawalnagar, E; DG Khan, F; Faisalabad, G; Gujranwala, H; Gujrat, I; Jhang, J; Jhelum, K; Kasur, L; Khanewal, M; Kuchai, N; Lahore, Laiyah P; Muzafargarh, Q; Nankanasahib, R; Narowal, S; Okara, T; Pakpatan, U; Parchanar, V; Rajanpur, W; Raiwind, X; Sahiwal, Y; Sargodha, Z; Sheikupura, AA; Sialkot, AB; Vehali, AC; Vehari
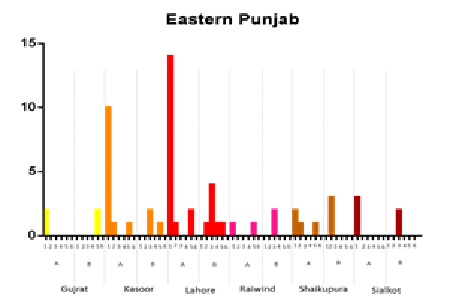
Figure 3: Comparison of allele frequencies in cities of Eastern Punjab for locus DQA1 and DQB1
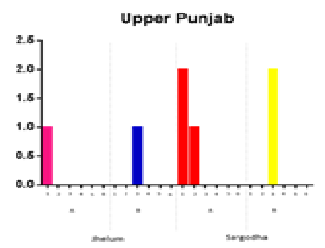
Figure 4: Comparison of allele frequencies between locus DQA1 and DQB1 in cities of Upper Punjab
In Upper Punjab, Jehlum displayed a similar frequency for allele 1 of locus DQA1 and allele 3 of locus DQB1, while all the other alleles for both loci showed zero frequency, as illustrated in Figure 4.
In the case of Sargodah, the highest frequency was observed for allele 1 of locus DQA1 and allele 3 of locus DQB1. However, when comparing allele 2 for both loci, the frequency was minimal for locus DQA1 and zero for locus DQB1. Hence, a similar frequency trend for alleles 1 and 3 was observed in the populations of Jehlum and Sargodha.
For FATA, Kuchai exhibited allelic frequency for DQA1*01, while the overall frequency of all the alleles for both loci was zero. In the case of Parachnar, a similar frequency trend was observed for locus DQA101/02 and DQB102/03, with allele 1 of locus DQA1 showing the highest frequency trend.
When the allelic frequencies were compared among different cities in Southern Punjab, including Bahawalnagar, Bahawalpur, Bhakar, DG Khan, Khanewal, Layyah, and Muzaffargarh, a similar frequency trend was observed. In particular, Rajanpur and Vehari showed the highest frequency for locus DQA101, while no frequency was observed for Bhakar and DG Khan. Consequently, the DQA101 allele exhibited the highest allelic frequency in Vehari compared to other alleles.
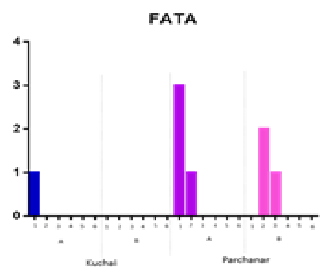
Figure 4: Comparison of locus DQA1 and DQB1 alleles for FATA
Allelic frequencies for the loci DQA1 and DQB1 were also compared among cities in central Punjab, as shown in Figure 6. Similar frequencies for different alleles were observed in Jhang, Pakpattan, Nankana Sahib, Okara, and Sahiwal. However, in the case of Faisalabad, the allelic frequency was highest for allele 1 of locus DQA1, as depicted in Figure 6. It is evident from Figure 6 that when allelic frequency of allele 1 was compared between both loci, zero frequency was observed for locus DQB1, but the maximum frequency was found for DQA1 in Faisalabad. As for Gujranwala, the same (maximum) allele frequency trend was observed for alleles 1 and 3 for both locus DQA1 and DQB1, while a similar frequency was noted for alleles 2 and 5 of locus DQA1 and allele 5 of DQB1. Consequently, allele 1 represented the highest frequency among all cities in central Punjab for locus DQA1.
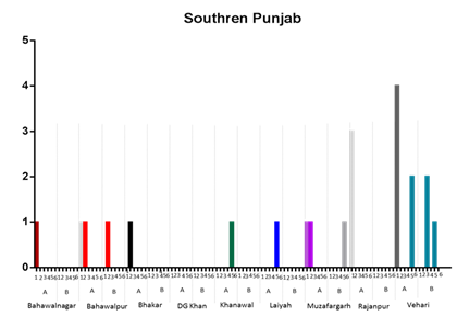
Figure 5: Comparison between allele frequencies of locus DQA1 and DQB1 in different cities of Southern Punjab
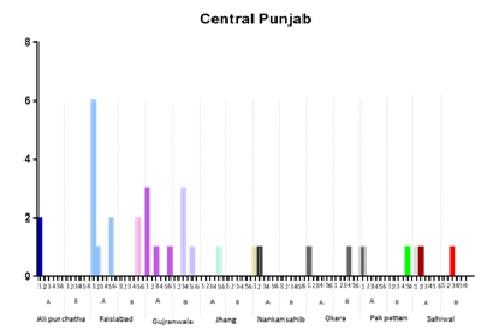
Figure 6: Comparison of allele frequencies in cities of central Punjab for locus DQA1 and DQB1
When comparing allele frequencies for the loci DQA1 and DQB1 among different ethnic groups, it was observed that allele 1 was the most frequent allele for locus DQA1, as compared to allele 1 for locus DQB1. A similar trend was noticed for allele 2 in both loci. Allele 3 had the highest allele frequency for locus DQB1, followed by DQA1. However, when the other ethnic groups, Sariki and Pashtu, were compared for loci DQA1 and DQB1, it was evident that the Punjabi population had all alleles for both DQA1 and DQB1 (as shown in the figure). Consequently, the highest allelic frequency was observed for the DQA1*01 allele in the Punjabi population.
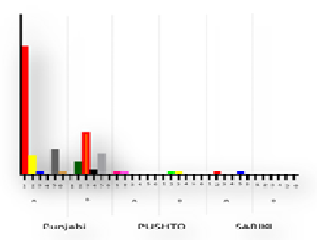
Figure 7: Comparison of allele frequency on ethnicity basis for locus DQA1 and DQB1. A represents locus DQA1 and B represents locus DQB1
When comparing allele frequencies between different genders, as illustrated in the graph, it is evident from Figure 8a that alleles 1, 2, and 5 of locus DQA1 exhibit a similar frequency in both genders, while allele 6 shows a higher frequency in male participants than in female participants. Furthermore, as shown in Figure 8b, allele 4 of locus DQB1 displays a consistent frequency trend for both genders; however, allele 3 of locus DQB1 has a higher frequency in males compared to female participants. Therefore, locus DQA106 and DQB103 alleles exhibit the highest frequency, while DQA101 and DQB104 alleles display the lowest frequency.
Comparison of Allele Frequencies in Different Age Groups
Allele frequencies for both locus DQA1 and DQB1 were compared across different age groups, including Group I (16-23 years), Group II (23-29 years), Group III (30-36 years), Group IV (37-43 years), Group V (44-50 years), and Group VI (> 50 years). The results are presented in Figure 9.
In Figure 9a, the highest allele frequency for allele 1 of locus DQA1 was observed in age groups II and IV, while the lowest frequency was found in age group 5. Figure 9b shows the highest frequency for age groups II, III, and VI, with zero frequency observed in age group V. For allele 3, as shown in Figure 9c, all groups, except for age group IV, displayed zero frequency. In Figure 9d, the highest allele frequency was observed for allele 5 in age group II, with zero frequency in age groups IV and V. As for allele 6, allele frequency was only observed in age group II, as depicted in Figure 9.
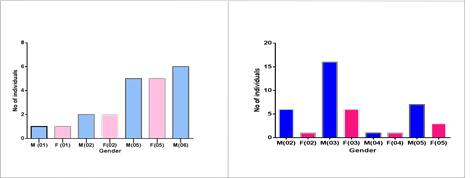
Figure 8: Comparison of allele frequencies on gender basis for locus DQA1 and DQB1. a) DQA1 locus, b) DQB1 locus.
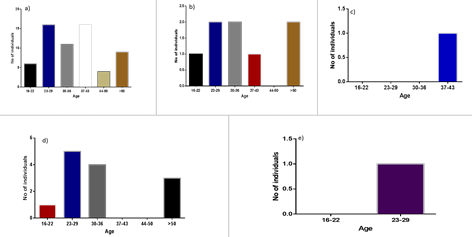
Figure 9: Comparison of allele frequencies among different age groups for locus DQA1. (a); allele 1, (b); allele 2, (c); allele 3, (d); allele 5, (e); allele 6. Group I (16-22), Group II (23-29), Group III (30-36), Group IV (37-43), Group V (44-50), Group VI (> 5)
When it comes to locus DQB1, alleles 1 and 6 exhibited zero frequency across all age groups, as depicted in Figure 10a and 10e. Figure 10b demonstrated the highest frequency for allele 2 among participants in age groups II and V. In Figure 10f, participants in age groups IV and V showed the highest frequency for allele 4, while zero frequency was observed in other age groups. In the case of allele 3, the highest frequency was observed in age group II, with groups I and V exhibiting the lowest frequency, as illustrated in Figure 10c. As for allele 5, Figure 10d revealed the highest frequency in groups IV and VI, while the minimum frequency was observed in groups I and II.
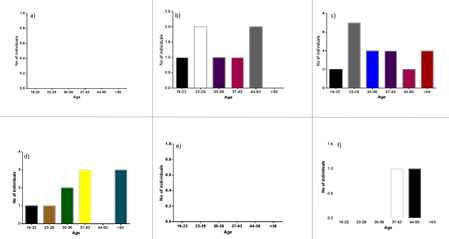
Figure 10: Different age groups showing different allele frequencies for locus DQB1. (a); allele 1, (b); allele 2, (c); allele 3, (d); allele 5, (e); allele 6, (f); allele 4. Group I (16-22), Group II (23-29), Group III (30-36), Group IV (37-43), Group V (44-50), Group VI (> 50).
When examining locus DQA1, the trend in allelic frequency was higher among donors compared to patients. The maximum frequency was observed for allele 3 among donor participants. Allele 5 exhibited a similar trend for both donors and patients, while allele 4 showed zero frequency for patients and a minimal frequency for donor participants, as depicted in Figure 11a.
As for locus DQB1, the maximum allele frequency among donor participants was observed for allele 1, while the minimum frequency was shown by allele 6 for donors and allele 3 for patients. Alleles 2 and 5 displayed a higher frequency for donor participants than for patients, with zero frequency observed for allele 3 among donor participants, as shown in Figure 11b.
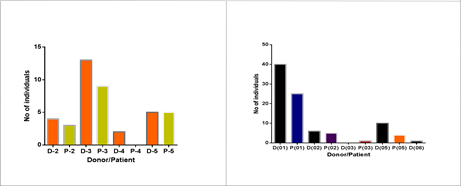
Figure 11: Allele comparison between locus DQA1 and DQB1 for Donor and Patient. a) DQA1 locus, b) DQB1 locus
Allele frequencies for locus DQA1 and DQB1 were compared among participants with different blood groups. Figure 12a, for locus DQA1, clearly shows that allele 1 had the highest frequency among individuals with blood type O+ and the lowest frequency among those with blood type B-. In the case of allele 2, a maximum frequency trend was observed for blood type O+, while blood types AB+ and B- exhibited zero frequency, as depicted in Figure 12b. For allele 3, there was zero frequency across all blood groups except for blood type B+, and the same pattern was observed for allele 6, which was only present in the O+ blood group, as shown in Figure 12c and 12e, respectively. In the case of allele 5, the highest frequency was observed for blood type O+, while AB+ and B- displayed the same minimum frequency trend, as illustrated in Figure 12d. Hence, DQA1*01/02/05/06 alleles exhibited the highest frequency among individuals with blood type O+.
For locus DQB1, Figure 13a displays the highest allele frequency among individuals with blood type O+, while the same frequencies were observed for blood types A+ and B+. In the case of allele 3, O- and AB+ exhibited the minimum frequency, while the highest frequency was observed for the B+ allele, as shown in Figure 13b. Figure 13c indicates that allele 4 had a similar frequency for both B+ and O+ blood groups. However, Figure 13d reveals that allele 5 had the highest frequency among individuals with blood type O+ and the lowest frequency among those with blood type AB+. It demonstrates that locus DQB1*02/04/05 had the highest frequency among individuals with blood type O+, while allele 3 was most frequent in the population with blood type B+.
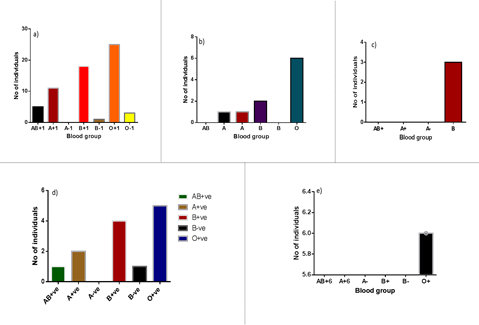
Figure 12: Comparison of locus DQA1 alleles for different blood groups. (a); allele 1, (b); allele 2, (c); allele 3, (d); allele 5, (e); allele 6.
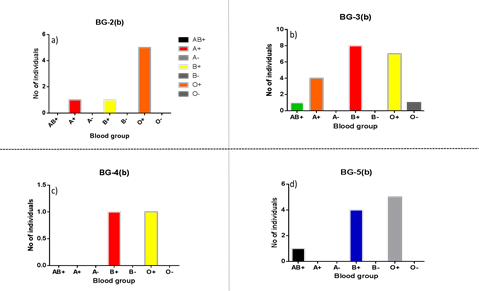
Figure 13: Comparison of allele frequencies of locus DQB1 on blood group basis. (a); allele 2, (b); allele 3, (c); allele 4, (d); allele 5.
Human leukocyte antigen (HLA) encompasses highly polymorphic genes located on chromosome 6p21[2], playing a pivotal role in immune functioning by defending against self and nonself antigens [15]. It consists of two classes: class I (HLA-A, HLA-B, and HLA-C) and class II (HLA-DP, HLA-DR, and HLA-DQ), which present antigen peptides to T-lymphocytes [16]. The aim of this research is to investigate the allelic diversity and variation in allelic frequencies of the HLA-DQA1 and HLA-DQB1 loci. The study focuses on the first six alleles of each locus and considers various parameters, including age, gender, donor/patient status, ethnic groups, cities, and blood groups for comparing allele frequencies.
A population sample of 100 participants was selected, and their data was compared with previous studies. Previous research has shown varying allele frequencies in different populations. For instance, in Jews and Arabs of Iran, allele 6 of locus DQA1 and allele 4 of DQB1 are less common and sometimes absent [17]. In Amerindians, DQA1*03/04/05 and DQB1*03/04 were found, while DQB1*03 was located in Jordanians, Italians, Turks, and Caucasians. DQB1*02 was found in Caucasians [18] and the Bahraini population [19]. In Jordanians, locus DQA1*02/03/05 was observed, and in the Lebanese population, DQB1*03 was the most common allele [20].
This study analyzed different cities in Pakistan to determine the levels of allele frequency for loci DQA1 and DQB1. It was observed that locus DQA1*01 had the maximum allele frequency in cities like Faisalabad, Lahore, Parchanar, Vehari, and Sargodha. For the Punjabi population, locus DQA1 showed a maximum frequency for allele 1, while locus DQB1 showed zero frequency, or in some cases, less frequent allele frequency was observed. When comparing allelic frequencies among different blood groups, locus DQA1*01/02/05/06 and DQB1*02/04/05 alleles were most frequent in O+ blood groups, while for blood group B+, locus DQA1*03 and DQB1*03 were more frequent. In the gender comparison, male participants exhibited higher frequencies for locus DQA1*06 and DQB1*03 compared to female participants. In the donor versus patient comparison, donor participants showed higher frequencies for DQA1*03 and DQB1*01. When comparing different age groups, age group II (22-29 years) exhibited the highest allele frequencies for locus DQA1*01/02/05 alleles, while for the DQB1 locus, a different frequency trend was observed, with alleles 1 and 6 showing zero frequency for all age groups.
Even distribution of allele frequencies is the result of balancing selection. Class I loci have higher diversity than class II loci due to allele, genotype, and haplotype polymorphism. This diversity is valuable in understanding disease progression and resistance, as well as in identifying disease-predisposing loci through linkage disequilibrium analysis.
This study significantly highlights the association and polymorphism of the HLA-DQA1 and HLA-DQB1 loci in the local population. The research investigated the prevalence of HLA loci DQA1 and DQB1 across different parameters, including gender, blood groups, ages, cities, and patients/donors. In the comparison of allele frequencies among different cities, HLA-DQA1*01/02/05 and HLA-DQB1*03/05 were observed to be most prevalent in the local population. Regarding gender differences, male participants exhibited the highest allele frequencies for Locus DQA1*06 and DQB1*03. In terms of blood groups, allele frequencies for locus DQA1*01/02/05/06 and DQB1*02/04/05 were most common in the O+ blood group. When comparing different alleles of loci DQA1 and DQB1, age group II displayed the highest frequencies for DQA1*01/02/05/06 and DQB1*02/03/05 alleles among all age groups.
In the context of patients and donors, the donor group showed a higher frequency for DQA1*02/03/05 alleles compared to DQB1*01/02/05 alleles. It's evident from this study that the allele diversity for the DQA1 locus is greater than that of the DQB1 locus.
[1]Centre of Excellence in Molecular Biology, University of the Punjab, Lahore, Pakistan
*Corresponding Author: faizaquddus13@gmail.com
[2]Department of Allied Health Sciences, Superior University, Lahore, Pakistan