Aisha Khalid1* | Ayesha Anwar1 | Roheela Yasmeen1 | Zahid Sharif2
1Department of Biology, Lahore Garrison University, Lahore, Pakistan.
2Fisheries Complex, Manwan Lahore, Pakistan
*Correspondence
Aisha Khalid
Email:draishakhalid@lgu.edu.pk
Nile tilapia (Oreochromis niloticus) is one of the most widely farmed fish species globally, contributing significantly to nutrition and economic growth, particularly in developing regions. This study examined the effects of diets containing 5%, 7% and 10% fish meal on the growth performance of O. niloticus under controlled aquaculture conditions for 90 days. Fish that fed a 10% fish meal diet (T3) had the best growth performance as compared to other treatment groups. The T3 group showed a significant increase in body weight and body length, which were significantly higher (P < 0.05) compared to control, T1 and T2 groups (178.92%, 97.64% and 120.96% respectively). This significant improvement in body weight and length illustrates that a 10% of fish meal inclusion rate has been the optimal point of growth efficiency of Nile tilapia, presumably because it increases protein supply and nutrient utilization. The proximate analysis of Nile tilapia also indicate that the high concentration of moisture (80.77 ± 0.81), ash (4.28 ± 0.07), crude fat (3.29 ± 0.11) and Crude Protein (63.06 ± 0.56) was recorded in T3 among the other diet treatments. The results suggest that moderate fish meal supplementation can enhance growth level and sustainable aquaculture production.
Keywords: Animal Feed, Aquaculture, Feed Efficiency, Fish Meal, Growth Rate, Oreochromis niloticus, Protein Supplementation
One of the most important elements of the global food system is aquaculture, which has a significant contribution to food security, nutrition and economic development. Over the past few years, the aquaculture sector in Pakistan has received extra attention due to the increased demand of fish as an inexpensive and high protein source. However, compared with other developing countries, Pakistan is still exhibiting relatively low productivity of its aquaculture, despite stable improvements in recent years [1]. The world Bank Fisheries reported that in Pakistan the average freshwater aquaculture yield is around 1000 kg/ha/year that is comparable with the Bangladesh around 1500 kg/ha/year but the intensive monoculture elsewhere is 2500 kg/ha/year [2]. Currently, aquaculture is exhibiting the highest food production growth rate around the globe, and it is an important sector in the national policies in reducing poverty, creating employment, and ensuring a sustainable food supply [3].
Tilapia (Oreochromis spp.) is known as a primary source of aquaculture fish worldwide, producing about 40 percent of the cultured fish. Globally these are also well known due to its adaptability, quick development and nutritional worth [4]. By 2018, the world had around 82 million tons of aquaculture production, and the figure is set to rise to 109 million tons by 2030 with an average production of 5.3% between 2001 and 2018 [1]. Nile tilapia (Oreochromis niloticus) is of the most significant cultured fish species, with nearly 4.5 million metric tons of production in 2018 alone [5]. Due to its adaptability to the different environmental conditions, such as freshwater, brackish water, and mildly saline water, Nile tilapia has the ability to be cultivated in a variety of aquaculture systems including ponds, tanks, and recirculating aquaculture systems (RAS) [6].
Tilapia species are mainly found in the freshwater habitat around rivers, ponds and lakes, though they can withstand low salinity levels under controlled conditions. In spite of invasive issues in certain environments, tilapia is among the most economically efficient fish in aquaculture on a global scale, and is the second most farmed fish following carps species [1] O. niloticus stands out due to its fast growth, adaptation to changes in the environment, and tolerance to temperatures between 25 and 30℃ [7]. Its neutral taste, adaptability in cooking, and superior protein content make it a favorable component of human diets globally [8]. Furthermore, as an omnivorous feeder, tilapia effectively utilizes a broad spectrum of natural and artificial feeds which makes it economically viable aquaculture species [9].
Therefore, the current study aimed to assess the growth performance of Nile tilapia (Oreochromis niloticus) fed diet containing 5%, 7% and 10% of fish meal protein under controlled aquaculture settings.
One hundred and eighty healthy Nile tilapia (Oreochromis niloticus) fingerlings were obtained from the Central Fish Seed Hatchery, Manawan, Lahore. The experiment trial was carried out at the Nutrition Laboratory, Fisheries Research and Training Institute, Manawan, Lahore.
The experimental design was based on four dietary treatments: one control diet (T0) and three experimental diets (T1, T2 and T3), contain 0%, 5%, 7% and 10% of fish meal protein respectively. Each treatment was conducted three times. Fish were hand-fed for 12 weeks at 5% of their body weight per day. Unconsumed feed and feces were siphoned out on a daily basis prior to feeding so as to keep water clean.
Fish were acclimatized in aerated tanks over the period of seven days prior to the commencement of the experiment. A commercial diet was given to the fish during the acclimatization to reduce the handling and environmental stress. After acclimatization, fish were then distributed into 12 glass aquaria (45 L). Three replicates of four dietary treatments (one control and three experimental diets) were placed in the aquaria. There were 15 fish in each aquarium resulting in the 45 fish per treatment group. Water was replenished four times a week to ensure its quality.
Feed ingredients for this experimental study were obtained from local suppliers and formulated into isonitrogenous and isoenergetic diets as per the recommendations of NRC (2011). A feed grinder and mixer were used to grind and mix the ingredients and pellet them. The air-drying of pellets was performed at the room temperature for 24 hours, followed by oven-drying at 60 ℃ for 12 hours, and then stored themin airtight containers.
The parameters of water quality were monitored regularly in accordance to standard procedures [10]. The temperature and pH was determined by using a thermometer and the pH meter respectively per day. In the meantime, other parameters such as pH, electrical conductivity, total dissolved solids (TDS), and total alkalinity were also measured. Parameters were held in optimum conditions in the culture of O. niloticus (Temperature: 26-29 oC; DO: >5 mg/L; pH: 7.0-8.0).
The proximate composition of all experimental diets was analyzed at Quality Control Laboratory, Manawan, Lahore, in accordance with AOAC methods [11]. The measured parameters included moisture, crude protein, crude fat, crude fiber, and ash values to ensure consistency across formulated feeds.
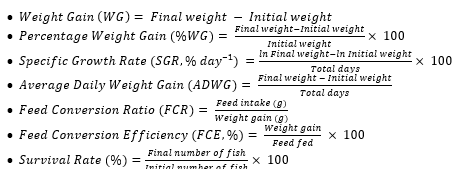
Feed consumption and growth were measured after every fortnight (14 days). Ten fish were randomly selected from each aquarium to measure wet body weight and total length to the nearest 0.01 g and 0.1 mm respectively and then placed back into their respective aquaria.
Growth and feed efficiency indices were calculated using the following formulas:
The experimental data were expressed as mean ± standard deviation (SD). Statistical analyses were performed using SPSS software (version 26.0). One-way analysis of variance (ANOVA) was conducted to compare differences among treatment groups, followed by Tukey’s post-hoc test to determine pairwise differences. Statistical significance was considered at P < 0.05 compared to the control group.
This was a 90 day experimental trial which assessed the effects of different levels of fish meal in the diet on water quality, growth performance, feed usage, and whole-body composition of Oreochromis niloticus. In the following subsections, the findings are provided.
The water quality parameters did not exceed the optimal range for O. niloticus during the experiment. The temperature ranged between 26 and 29℃, giving favorable conditions for growth. The level of dissolved oxygen remained above 5 mg/L, which was adequate oxygenation. The pH level was maintained between 7.0 to 8.0. Total alkalinity was maintained at 140 to 180 mg/L, water hardness ranged from 200 and 260mg/L, and the electrical conductivity was kept at 1300-1800 µS/cm. Salinity level was maintained at 0.5 ppt, and the chloride content was ranged
Table 1. Water Quality Parameters (Mean ± SD) During the Experimental Period
|
Parameter |
Mean ± SD |
|
Temperature (°C) |
27.5 ± 1.0 |
|
Dissolved Oxygen (mg/L) |
5.8 ± 0.3 |
|
pH |
7.5 ± 0.2 |
|
Total Alkalinity (mg/L) |
160 ± 12 |
|
Total Hardness (mg/L) |
230 ± 15 |
|
Electrical Conductivity (µS/cm) |
1550 ± 120 |
|
Total Dissolved Solids (mg/L) |
780 ± 60 |
|
Salinity (ppt) |
0.4 ± 0.05 |
|
Chloride (mg/L) |
90 ± 8 |
|
Ammonia (mg/L) |
0.015 ± 0.004 |
|
Nitrate (mg/L) |
2.3 ± 0.4 |
Table 2. The Proximate Composition of Experimental Diets
|
Sr. No |
Parameters |
Control (%) |
T1 (%) |
T2 (%) |
T3 (%) |
|
1 |
Moisture |
18.49 ± 0.24 |
14.66 ± 0.31 |
15.03 ± 0.27 |
16.09 ± 0.33 |
|
2 |
Ash |
11.34 ± 0.18 |
6.04 ± 0.22 |
6.33 ± 0.25 |
8.56 ± 0.19 |
|
3 |
Crude Fat |
0.89 ± 0.06 |
1.96 ± 0.09 |
2.09 ± 0.11 |
1.78 ± 0.07 |
|
4 |
Crude Protein |
14.99 ± 0.42 |
21.94 ± 0.37 |
25.57 ± 0.45 |
28.79 ± 0.52 |
|
5 |
Crude Fiber |
3.43 ± 0.10 |
4.43 ± 0.14 |
4.65 ± 0.12 |
5.01 ± 0.11 |
|
6 |
Carbohydrates |
65.34 ± 0.56 |
66.12 ± 0.48 |
59.88 ± 0.53 |
51.98 ± 0.61 |
between 70 and 110 mg/L. The Ammonia level was also kept at less than 0.02 mg/L that is ideal and acceptable safe limit. Such findings demonstrate that the culture conditions for O. niloticus remained in a steady and suitable environment (Table 1).
The proximate composition of feed differed significantly across treatments. The amount of moisture and ash was highest in the control group, however, protein and fiber increased with the increase in percentage of protein content that is 28.79 ± 0.52 protein and 5.01 ± 0.11 fiber in T3. There was also an increase in crude fat level in treated groups as compared to control groups. On the other hand, carbohydrate levels first increased in the T1 treatment as compared to the control and then decreased in T2 and T3 group that is 51.98 ± 0.61% in T3 group. The results have shown that the treatments used in this study improved the nutritional value of feed, specifically by increasing protein levels and reducing moisture and ash levels (Table 2). Whole-body composition findings (Table 2) showed that there was significant increase (P < 0.05) in crude protein, crude fat and ash content of fish fed (experimental) diets, specifically in T3. There were non-significant but slight differences in the contents of moisture and crude fiber across the treatments.
3.3 Proximate Analysis of Fish
The proximate composition of Oreochromis niloticus indicated that there were significant differences in treatments, which are a result of inclusion of fish meal in the diet. Moisture and crude protein contents increased steadily from
Table 3. Proximate analysis of Oreochromis niloticus fed experimental diets (Mean ± SD)
|
Sr. No. |
Parameters |
Control (%) |
T1 (%) |
T2 (%) |
T3 (%) |
|
1 |
Moisture |
60.52 ± 0.54 |
65.93 ± 0.63 |
72.31 ± 0.72 |
80.77 ± 0.81 |
|
2 |
Ash |
4.01 ± 0.08 |
4.09 ± 0.06 |
3.82 ± 0.05 |
4.28 ± 0.07 |
|
3 |
Crude Fat |
0.98 ± 0.04 |
1.98 ± 0.06 |
2.77 ± 0.09 |
3.29 ± 0.11 |
|
4 |
Crude Protein |
30.09 ± 0.33 |
44.69 ± 0.41 |
56.13 ± 0.47 |
63.06 ± 0.56 |
Table 4. The initial and final body weight and body length of O. niloticus across different treatment groups
|
Fortnight |
Initial Body weight |
Final body weight |
Initial Body length |
Final body length |
|
Control (Group A) |
17.70±0.90 |
32.72±0.39 |
58.36±1.20 |
80.8±0.45 |
|
T1 (Group B) |
18.28±0.86 |
36.13±0.53 |
61.73±1.45 |
85.77±0.35 |
|
T2 (Group C) |
19.13±0.27 |
42.27±1.82 |
61.5±2.06 |
90.83±1.06 |
|
T3 (Group D) |
18.74±0.45 |
52.27±0.37 |
60.46±0.97 |
98.23±0.56 |
the control to T3, with the highest values being recorded in the fish being fed with the 10% fish meal diet (80.77 ± 0.81% and 63.06 ± 0.56%, respectively). The dietary fat levels also showed significant elevation with the increase in the dietary levels of fat meal as it was 3.29 ± 0.11 in T3 and 0.98 ± 0.04 in the control. On the other hand, ash content showed little variation in response to different treatments, ranging from 3.82 ± 0.05 to 4.28 ± 0.07. These results indicate that a higher level of dietary fish meal concentration results in increased nutrient deposition especially protein and lipids, therefore improving the nutritional composition of Nile tilapia. High protein content observed in T3 demonstrates elevated efficiency of feeding and growth metabolism of high-quality amino acid profile of fish meal (Table 3).
3.4 Average Weight and Length
Table 4 shows the initial and final average body weight and body length of O. niloticus in the various treatment groups. The findings indicate that both the body weight and the body length increase progressively from the control group (T0) to the highest level of treatment (T3). Fish in T3 showed the highest growth performance, with a body weight of 52.27 ± 0.37 g and body length of 98.23± 0.56 mm, which were significantly better than those of the control. These results indicate that the treatments that were applied had positive effects on the growth parameters of tilapia in the experimental setting (Table 4). O. niloticus showed significant growth performance differences among treatments (P < 0.05). T3 showed the highest total growth, followed by T2, T1 and the control (T0) group. The findings showed the progressive increase in weight gain, length gain, specific growth rate (SGR), and average daily weight gains as the treatment level increased. Notably, all experimental groups recorded 100% survival rate, which showed good rearing conditions and no mortality during the experiment.
Table 5 shows how various dietary treatments effect on percentage weight gain (%WG) of Nile tilapia (Oreochromis niloticus). The findings indicate that weight gain increased gradually with the higher levels of fish meal in the diet. It was observed that the control group was at the lowest weight gain (84.8%), while T1 (97.64%) and T2 (120.96%) showed intermediate improvements, which reflects to the beneficial effect of dietary protein enrichment. The maximum weight gain (178.92%) was observed in fish that was fed diet T3, which had the highest percentage of fish meal.
Table 5. Impact of diet on the percentage weight gain (%WG) in Nile tilapia
|
Sr. No. |
Groups |
Percentage weight gain (%WG) |
|
1 |
Control |
84.8 |
|
2 |
T1 |
97.64 |
|
3 |
T2 |
120.96 |
|
4 |
T3 |
178.92 |
3.6 Feed Conversion Ratio (FCR) and Feed Conversion Efficiency (FCE)
There was a significant difference in Feed Conversion Ratio (FCR) and Feed Conversion Efficiency (FCE) between the treatments. The T3 group had the lowest FCR (1.31 ± 0.02) and highest FCE (76.28 ± 0.56%), demonstrating more efficiency in the feed utilization than other groups.
The current study showed significant improvement in growth performance, feed utilization efficiency and body composition of Oreochromis niloticus fed the T3 diet, which showed that this diet is better in nutritional quality and digestibility than the other treatments. Possibly, increase in weight gain (WG) in the T3 group was significant, which indicates that the dietary formulation enhanced protein availability and improved nutrient absorption and provided more effective somatic growth. Such results are consistent with those suggested by Adeoye et al. [12] and Zhang et al. [ 13], who reported that optimized diets with functional ingredients or fermented feedstuffs enhance growth rates and feed efficiency in tilapia and other aquaculture species.
Feed Conversion Ratio (FCR) and Feed Conversion Efficiency (FCE) are also important measures of the extent of effective conversion of feed into biomass. T3 had the best feed utilization and metabolic efficiency because it had the lowest FCR (1.31 ± 0.02) and highest FCE (76.28 ± 0.56%). Better FCR values are likely to indicate increased digestibility and improved nutrient retention [14]. The findings by Hasan et al. (2022) also revealed similar patterns with the researchers demonstrating that dietary supplementation with probiotics and enzyme treated ingredients reduced FCR and improved FCE in O. niloticus. This improvement can be explained by the higher activity of digestive enzymes, better health of the gut, and the higher efficiency of nutrient absorption [15, 16].
The increased performance in T3 might also be attributed to improved protein synthesis and energy consumption. Optimal ratios between proteins and energy and balanced amino acid profiles are associated with efficient conversion of feed into muscle tissue [17]. Falaye et al. [ 18] reported that diets that are higher in protein digestibility and lower in anti-nutritional factors lead to better WG and feed efficiency. Moreover, it is common to increase nutrient availability by fermenting or bioprocessing of feed ingredients with complex polysaccharides, reducing phytate levels, and improving amino acid compositions [19]. This may explain the better growth performance of T3 group than others.
The whole body proximate composition further confirms the nutritional benefits of the T3 diet. T3-fed fish had much higher crude protein and lipid contents, but the difference in moisture and fiber was non-significant. Such results indicate that the diet improved efficient deposition of nutrients in muscle tissue, which is an indication of a better anabolic metabolism [20]. When the body protein level is high, it means that the dietary protein is well utilized in muscle development rather than being used to generate energy [9]. Similarly, might be associated with the heightened lipid metabolism and augmented energy stores, the elevated lipid content of fish fed T3 could be connected [21]. Similarly, the elevated lipid content of the fish fed T3 diet might be associated with the enhanced lipid metabolism and increased energy storage level.
T3 also improved the ash content, which suggests increased deposition of vital minerals, probably due to improved bioavailability or retention of minerals in the feed associated with improved feed composition [22]. Li et al. [23] also reported that the mineral-enriched or biofortified feeds significantly increased whole-body ash, skeletal development and metabolic stability in fish. The small, nonsignificant differences in moisture and fiber are aligned with the previous results reported by Taufek et al. [24], who reported that changes in these nutrients are less affected by the variations in diet when protein and lipid levels are in the optimal range.
Taken together, these results indicate that the T3 diet maximized nutrient assimilation and metabolic efficiency, which resulted in enhanced growth and body composition in O. niloticus. The improved performance was due to the synergistic actions of increased digestibility, optimal nutrient proportions, and potentially functional feed components. The same positive gains have been reported with the inclusion of fermented plant-based ingredients, probiotics, or enzyme-supplemented diets in fish feed preparation [25, 26]. These dietary interventions not only enhance growth and FCR, but also boost the intestinal condition and immune response, which supports sustainable performance of aquaculture [ 26].
The findings revealed that, as the percentage of fish meal in the diet increased, there was an increase in weight gain. The positive role of dietary protein enrichment was demonstrated by the lowest improvement observed in the control group (84.8%), followed by moderate improvements in T1 (97.64%) and T2 (120.96%), respectively. The maximum increase in weight (178.92%) was observed in the fish fed the T3diet, which contained the highest percentage of fish meal. This indicates that the inclusion of fish meal greatly contributed to the growth performance, probably due to its high-quality protein, balanced composition of amino acids, and digestibility which improve better feed consumption, and muscle growth [ 6, 8]. This trend supports the fact that the increase of the contents of animal protein products (e.g., fish meal) in the diet has a direct impact on the anabolic processes and enhances the growth efficiency of Nile tilapia [18]. Therefore, diet T3 was the most effective in enhancing optimal growth, highlighting fish meal being an essential ingredient in the development of nutritious aquafeeds.
Overall, the experimental study indicates that the proximate composition of the T3-fed O. niloticus are high among the other control and treatment fed groups. These findings justify the consideration of bio-processed or fortified feed ingredients as an economical approach to improve the yield of aquaculture systems and also fish quality.
Physicochemical parameters of the tank water such as the temperature, pH, and hardness were kept within optimal ranges to culture Nile tilapia. The results reveal that fish meal is an important ingredient in commercial culture of Oreochromis niloticus because its composition increases the protein deposition and the general growth performance. Thus, an inclusion level of 10% fish meal can be regarded as a good option when it comes to better growth and feed performance of Nile tilapia.
We are very grateful to the Department of Fisheries, Government of Punjab, Manwan Lahore, Pakistan for providing support and resources for the research work.
AA performed experimental work, AK wrote the manuscript, RY contributed in data analysis and Proof reading and, ZS contributed in experimental work
The authors declare no conflict of interest.
Not applicable.
The authors confirm that no generative artificial intelligence tools were used in the preparation, analysis, or writing of this manuscript.
This research work did not receive any funding from private, public, commercial and non-profit organization.