Comparison of the Effectiveness of ABSI and its Z-Score in Predicting the Prevalence of Dyslipidemia
Muhammad Shoaib[1], Muhammad Shoaib Khan1*
|
KEYWORDS Dyslipidemia, CHD, Lipoproteins, LBSIZ, Z-score of ABSI |
AbstractDyslipidemia is an abnormality of any lipoprotein fractions (TC, TG, LDL, and HDL). It is important to study the population to monitor risk factors for dyslipidemia and coronary heart disease (CHD). However, few population-based studies related to lipid levels were conducted in Pakistan. In this cross-sectional study, the prevalence of dyslipidemia in the local population (80 participants; 30 females and 50 males) was assessed. The studied population showed abnormalities in at least one lipid fraction including TC, LDL, TG, and HDL. According to abnormal lipid fractions, 89% of the participants were dyslipidemic with more prevalence in the rural population. The gender-wise comparison showed that males were more likely to have dyslipidemia than females due to their abnormal lipid profile. The most common form of dyslipidemia was low HDL (77%), followed by high TG (36%). Various traditionally introduced anthropometric and metabolic parameters were assessed to determine the severity of dyslipidemia, but they were not strong predictors of dyslipidemia due to their limitations. To overcome these limitations, newly introduced anthropometric parameters, namely LBSIZ and the Z-score of ABSI were applied. However, ABSI and its Z-score were also not strong predictors of dyslipidemia. |
INTRODUCTION
Currently, cardiovascular diseases are the leading cause of mortality and morbidity worldwide. While countries of all economic categories are affected by cardiovascular disease epidemics, complications related to cardiovascular diseases are increasing most rapidly in developed countries [1], [2]. Cardiovascular diseases (CVD) have multiple risk factors including stress, increasing age, diabetes mellitus, hypertension, hyperlipidemia, obesity, smoking, alcohol consumption, and a positive family history of CVD [3], [4]. According to a study in 2005, the global number of cardiovascular deaths (rheumatic heart disease, stroke, coronary artery diseases) rose from 14.4 million in 1990 to 17.5 million in 2005. Of these deaths, 5.7 million (32%) were attributed to stroke and 7.6 million (43%) to coronary heart diseases. According to WHO (World Health Organization), 80 % of deaths occurred in low and middle-income countries [5]. In 2015, WHO estimated that cardiovascular disease caused 20 million deaths, approximately 30% of the deaths worldwide [5]. According to the third report of the National Cholesterol Education Program (NCEP), South Asian populations are more likely to develop CVD at a young age [6]. Additionally, CVD accounts for 24% of all deaths in adults aged 25-69 years in the South Asian population. The prevalence of cardiovascular diseases in the Indian population is high and alarming situation [7], [8]. Researchers have proposed that, in the future, contagious diseases will cause more than three-quarters of deaths worldwide [9]. CVD alone is responsible for more deaths in low-income countries than in all other infectious diseases combined including AIDS/HIV, malaria, maternal and perinatal conditions, tuberculosis, and nutritional disorders combined [10]. Therefore, CVD is a major contributor to global mortality today, and it is expected to dominate this trend in the future [11], [12].
There is a well-established link between dyslipidemia and cardiovascular diseases. The high prevalence of CVD in the South Asian population is documented to be due to lipid abnormalities [13]. CVD is a multifactorial disease influenced by the interaction of different exogenous and endogenous factors [4]. Among the different risks of CVD, dyslipidemia is one of the most important factors [6]. The prevalence of dyslipidemia varies depending on different factors including age, race, socio-economic and cultural factors as well as genetic and lifestyle-based factors [14]. Both genetic and environmental factors contribute to the development of dyslipidemia [15]. The major constituents of the lipid profile are Triglycerides (TG), Total Cholesterol (TC), and very low-density lipoprotein (VLDL), low-density lipoprotein (LDL), and high-density lipoprotein (HDL). Dyslipidaemias is a collection of metabolic imbalances characterized by any or a combination of the following: elevated TG (>150mg/dL), elevated TC (>200mg/dL), elevated LDL-C (>130mg/dL), and low HDL-C (<50mg/dL in woman and <40mg/dL in man) [15]. Different genes are involved in the synthesis and metabolism of these components. Genetic factors include low expression of various genes, ABCA1, lipoprotein lipase (LPL), Apolipoprotein A-1 (ApoA1), APO-E, Lecithin cholesterol acyl transferase LCAT [16]. Abnormalities in these genes lead to the development of various lipid metabolic disorders. It is reported that genetic risk factors explain nearly 20-60% of cases of coronary artery diseases [17]. Any type of abnormality in these components develops the risk of CVD. Lots of evidence supports the link between the risk of CVD and a family history of dyslipidemia.
Studies have reported on lipid abnormalities and the genetics of dyslipidemia in both Indian and Chinese populations. In addition, lipid abnormalities have been found in the Pakistani population. According to study [18], about 63% of the studied population were dyslipidaemic. Currently, more work is needed on population-based studies on dyslipidemia in Pakistan. In the present work, we checked the environmental effect on lipid profile variations by comparing the lipid profiles of rural and urban populations. Moreover, this study also demonstrates the role of anthropometric parameters in assessing and determining the severity of dyslipidemia. The classic and newly introduced anthropometric characteristics of dyslipidemia compared between rural and urban populations, and this study focussed on comparing ABSI and LBSIZ to find a better way to assess dyslipidemia.
Table 1: Lipoprotein with size, lipids, and apolipoprotein contents [22]
|
Lipoprotein |
Size (nm) |
Major lipid content |
Apolipoproteins |
|
Chylomicron |
>75 |
Triglyceride |
ApoB-48, Apo C, Apo E, Apo A-I, A-II, |
|
Chylomicron remnants |
30-75 |
Triglyceride, Cholesterol |
Apo B-48, Apo E |
|
VLDL |
30-75 |
Triglycerides |
Apo B-100, Apo C, Apo E |
|
IDL |
25-35 |
Triglyceride, Cholesterol |
Apo B-100, Apo C, Apo E |
|
LDL |
<25 |
Cholesterol |
Apo B-100 |
|
Lap (a) |
30 |
Cholesterol |
ApoB-100, Apo(a) |
|
HDL |
<15 |
Cholesterol, phospholipids |
Apo A-1, A-II, Apo C, Apo E |
Lipoproteins and Apolipoproteins
Lipoproteins are complex plasma particles that consist of a core of triglycerides and cholesterol esters enclosed by free cholesterol, apolipoproteins, and phospholipids. They are categorized based on size, density, and major apolipoprotein and lipid content [19]. On the other hand, apolipoproteins are structural proteins that bind cholesterol and triglycerides, which allow the development of lipoproteins [20]. They play essential roles in metabolism and lipoprotein structure. Apolipoproteins act as ligands for lipoprotein receptors and as inhibitors or activators of enzymes involved in lipoprotein metabolism [21]. The apolipoprotein content, structure, and size of the lipoproteins (chylomicrons (CM), very-low-density lipoprotein (VLDL), High-density lipoprotein (HDL), intermediate-density lipoprotein (IDL), low-density lipoprotein (LDL), and lipoprotein A), determine their particular atherosclerotic risk profiles. Some important features of these contents are discussed in Table 1.
MATERIALS AND METHODS
Participants, Study Protocols, and Ethics
In this study, blood samples were collected from 80 healthy subjects (50 males, 30 females) from both urban and rural areas of Pakistan including Lahore (Punjab) and Zhob (Baluchistan), aged 16 to 60+ years. The studied population was classified based on various demographic factors, including BMI, gender, and age. Subjects with subsequent conditions were excluded: severe bacterial/viral infections and BMI <22. Based on age, the population was classified into five groups: Group I (16-28), Group II (29-39), Group III (40-50), Group IV (50-60), and Group V (>60). The population studied was also classified on basis of BMI, following the guidelines of the World Health Organization [23]. According to the Pakistan Standard Classification of Occupations (PSCO) [24], the studied population was comprehensively categorized into two groups. Group I (Blue-collar) including armed officers, office boys, farmers, and drivers and Group II (White-collar) including students, professionals, businessmen, and housewives. The study protocol was approved by the Ethical Committee at University of the Management and Technology, Lahore. Approval was obtained before blood was withdrawn from each of the study subjects.
Assessment of Different Anthropometric and Metabolic Parameters
Body weight was measured using a standard analog weighing scale. The measurements for waist circumference (WC) and height were measured using a non-stretchable measuring tape. All measurements were taken without sweaters, jackets, and shoes. Waist circumference was measured at the midway section between the iliac crests and costal margins during minimal respiration. Systolic and diastolic blood pressure were measured using a digital sphygmomanometer, according to the recommended techniques. A commercially available kit, Glucose-Liquizyme GOD-PAP Spectrum was used to estimate fasting plasma glucose levels spectrophotometrically. BMI, BRI, ABSI, LBSIZ, and Z-score of ABSI were calculated according to standardized formulas as:
BMI = Weight / Height [25].
Z-score of ABSI= ABSI- ABSI mean / ABSISD
Blood Sample Collection
After 10 ± 2 h of fasting, intravenous blood was collected from all the participants following the guidelines of the National Committee for Clinical Laboratory Standards (H18-A4) [26]. After that blood was stored in EDTA-containing tubes, all samples were processed within 30 minutes of collection and plasma was quickly separated for lipid profiling.
Determination of Plasma Lipid Levels
Plasma total cholesterol (TC) and triglyceride (TG) levels were determined spectrophotometrically using commercially available kits from Analyticon Biotechnologies AG (4046 and 5052, respectively). For the estimation of high-density lipoprotein cholesterol, other lipoprotein fractions were precipitated using HDL precipitation reagent from Analyticon Biotechnologies AG, 4046. HDL was then estimated using the aforementioned Analyticon kit to quantitatively determine cholesterol [27]. For the estimation of low-density lipoprotein cholesterol, we used the recently described method [28], in which the abnormality status was determined by the National Cholesterol Education Program (NCEP) Adult Treatment Panel III (ATP III) guidelines.
Statistical Analysis
Graph pad Prism software (version 6) was used for statistical analysis. Two tailed unpaired t-tests were used to assess the significance of relationships between two variables. No significant relationships were found among different lipid levels (HDL, LDL, TGs, and TC), metabolic parameters and anthropometric parameters.
RESULTS
Contribution of Lipoprotein Fractions to the Prevalence of Dyslipidemia
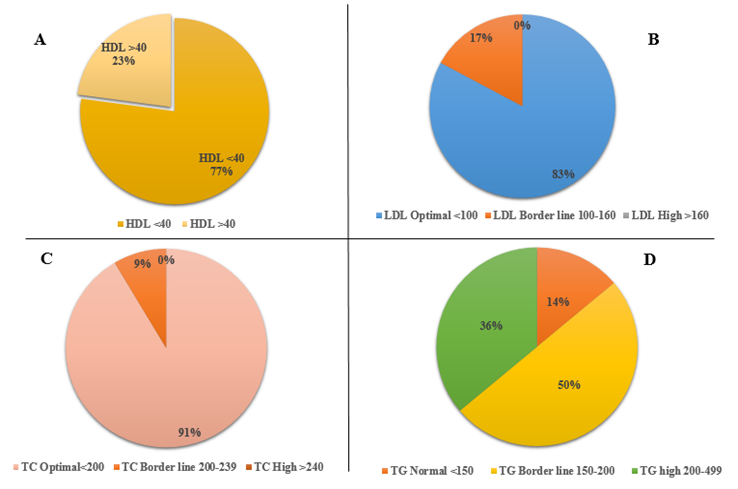
In the studied population, 23% of the subjects had normal level of HDL, while the remaining 77% had abnormal HDL levels (Figure 1).
The overall percentage of LDL and TG in the studied population (Figure 1B and 1C). According to the different LDL categories, 83% had normal LDL levels and 17% were at the borderline. While according to the different TG categories, 14% of the studied population had a normal level, 50% were at the borderline and the remaining 36% of them had a high level. The total percentage of TC in the studied population is shown in (Figure 1D). No one had a high level of TC, 91% of them were at the borderline, and just 9%, had a high level of TC respectively.
Figure 1. Total percentage of subgroups of lipoprotein fractions in the studied population: A: Highlighted the overall percentage of subgroups (HDL>40 and HDL<40) of HDL, B: Highlighted the overall percentage of subgroups (LDL optimal <100, LDL Border line 100-160, LDL High >160) of LDL, C: Highlighted the overall percentage of subgroups (TC optimal< 200, TC border line 200-239, TC high >240) of TC, D: Highlighted the overall percentage of subgroups (TG normal <150, TG Borderline 150-200), TG high 200-239) of TG.
Percentage of Dyslipidemia in the Studied Population
In the studied population, 89% of the subjects had abnormalities in at least one lipid fraction including TC, LDL, TG, and HDL (Figure 2). The most usual form of dyslipidemia was low HDL (77%) followed by high TG (36%).
Relation of BMI and Obesity
BMI is the classic anthropometric parameter to find out about obesity. The relationship between BMI and obesity in the studied population is shown in Figure 3. Different subjects showed different BMIs, as 39%, 37%, and 24% had normal, pre-obese, and obese individuals respectively. Therefore, according to BMI categorization, 61% population has abnormal BMI and classified as obese.
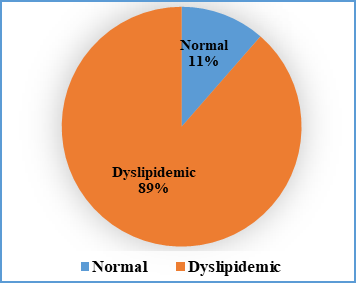
Figure 2: Percentage of dyslipidemia in the studied population. Blue colour represented the percentage of normal population, orange colour represented the percentage of abnormal (dyslipidemic) population
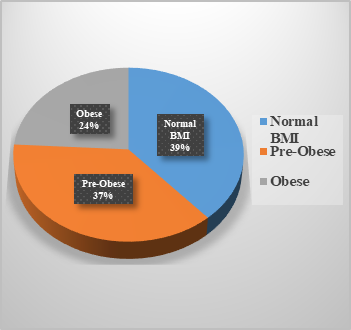
Figure 3: Percentage of obesity to BMI in the studied population
Relation of Lipoprotein Fractions with Rural and Urban Population
Plasma lipid fractions (TC, TGs, HDL, and LDL) of rural and urban populations were compared (Figure 4). Different categories of HDL in rural and urban populations showed non-significant differences, but the average HDL value was abnormal in the rural population (Figure 4A). While the LDL, TC, and TG categories showed statistically non-significant differences with the high average values in the rural population (Figure 4B, 4C, 4D).
Relation of Lipoprotein Fractions with Gender
Gender wise comparison of plasma lipid levels (Figure 5). Different categories of HDL showed non-significant differences as both genders were observed to have abnormal levels of HDL but the average value of HDL was high in males (Figure 5A). While TC, TG, and LDL showed non-significant differences with higher average values in males (Figure 5B, 5C, 5D).
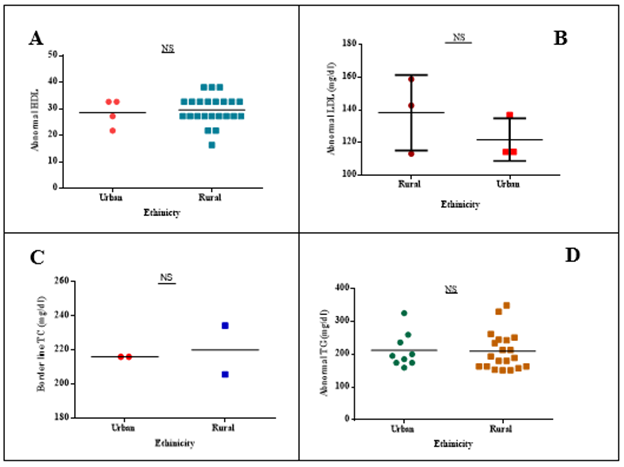
Figure 4: Relation of lipoprotein fractions with rural and urban population. (A): HDL (Abnormal) relation with rural and urban, (B): LDL (Abnormal) relation with rural and urban, (C): TC (Abnormal) relation with rural and urban, (D): TG (Abnormal) relation with rural and urban, NS showed non-significant values. (NS= non-significant values)
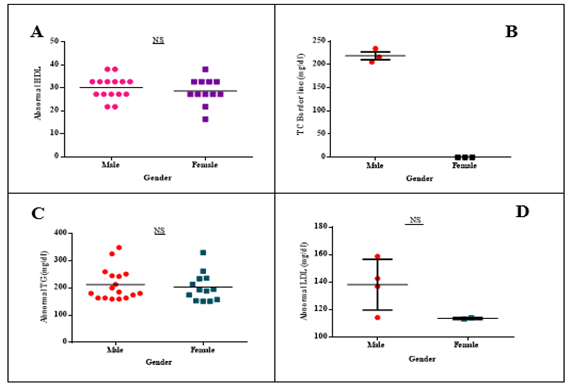
Figure 5: Relation of lipoprotein fractions with Gender (male and female). (A): HDL (Abnormal) relation with gender, (B): TC (Abnormal) relation with gender, (C): TG (Abnormal) relation with gender, (D): LDL (Abnormal) relation with gender, NS shows non-significant values. (NS= non-significant values)
Relation of Lipoprotein Fractions with Different Groups of Occupation
Plasma lipid fractions for different occupational groups were compared (Figure 6). All the lipid fractions showed statistically non-significant differences but the average value of abnormal HDL was low in the blue-collar category while LDL, TG, and TC average values were high in the white-collar category.
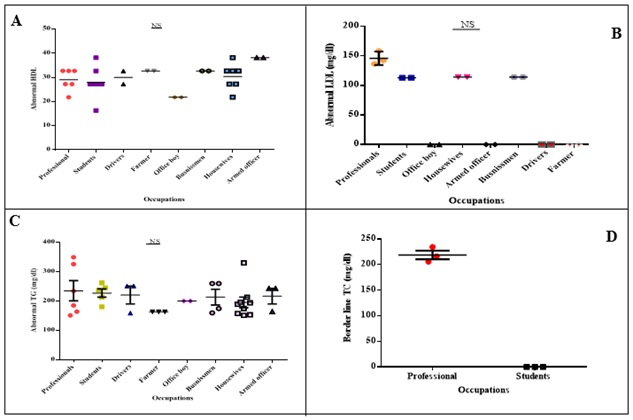
Figure 6: Relation of lipoprotein fractions with different groups of occupation. (A): HDL (Abnormal) relation with different groups of occupation, (B): LDL (Abnormal) relation with different groups of occupation, (C): TG (Abnormal) relation with different groups of occupation, (D): TC (Abnormal) relation with different groups of occupation, NS shows non-significant values. (NS= non-significant values)
Anthropometric and Metabolic Assessment of Lipoprotein Fractions
HDL
In the studied population, different anthropometric and metabolic parameters were compared between normal and abnormal HDL levels. Overall non-significant difference was observed, participants having abnormal HDL levels, showed the higher values for systolic BP, diastolic BP, BMI and L-BSIZ, remaining metabolic and anthropometric parameters showed lower values is shown in Figure 7.
TC
In the studied population, different anthropometric and metabolic parameters between subgroups of TC (normal and abnormal TC) were compared. LBSIZ showed a significant difference of (p*<0.05) and remaining all parameters showed a non-significant difference. The participants having abnormal TC values, showed higher values for all anthropometric and metabolic parameters in the studied population except BMI and BRI is shown in Figure 8.
TG
In the studied population, different anthropometric and metabolic parameters between subgroups of TG (normal and abnormal TG) were compared. Overall non-significant difference was observed, participants having abnormal TG values showed higher values for all anthropometric and metabolic parameters in the studied population except ABSI, BRI, and Z-score of ABSI is shown in Figure 9.
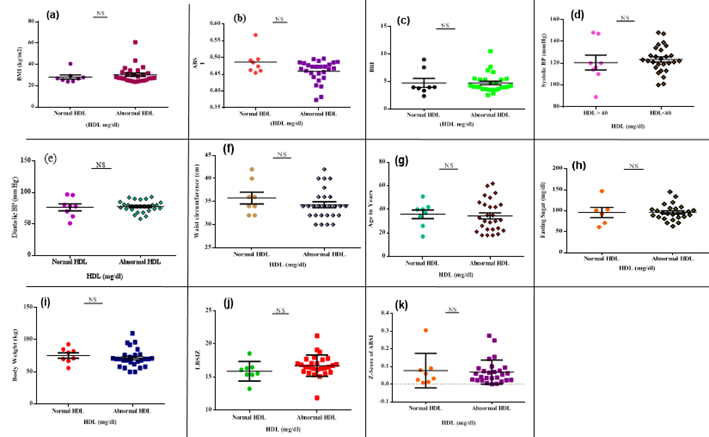
Figure 7: Anthropometric and metabolic parameters in the assessment of HDL. The scattered plot represents the values for different metabolic and anthropometric parameters in subgroups of HDL classified into (abnormal and normal HDL). (a): BMI and severity of HDL level, (b): ABSI relation with HDL, (c): BRI relation with HDL, (d): Systolic BP relation with HDL level, (e): Diastolic relation with HDL, (f): WC relation with HDL, (g): Effect of age on the severity of HDL, (h): Fasting sugar relation with HDL, (i): Body weight relation with HDL, (j): LBSIZ relation with HDL, (k): Relation of Z-score of ABSI and HDL. (NS= non-significant values)
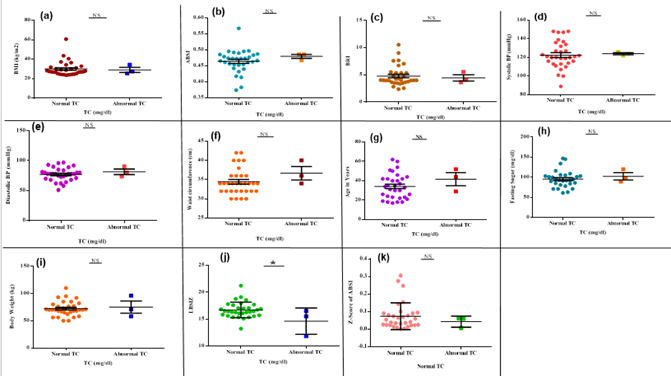
Figure 8: Anthropometric and metabolic parameters in the assessment of TC. Scattered-plot represent the values for different metabolic and anthropometric parameters in subgroups of TC classified into (abnormal and normal TC). (a): BMI and severity of TC level, (b): ABSI relation with TC, (c): BRI relation with TC, (d): Systolic BP relation with TC level, (e): Diastolic BP relation with TC, (f): WC relation with TC, (g): Effect of age on the severity of TC, (h): Fasting sugar relation with TC, (i): Body weight relation with TC, (j): LBSIZ relation with TC, (k): Relation of Z-score of ABSI and TC.* shows statistically significant values of <0.05 while NS-shows non-significant values
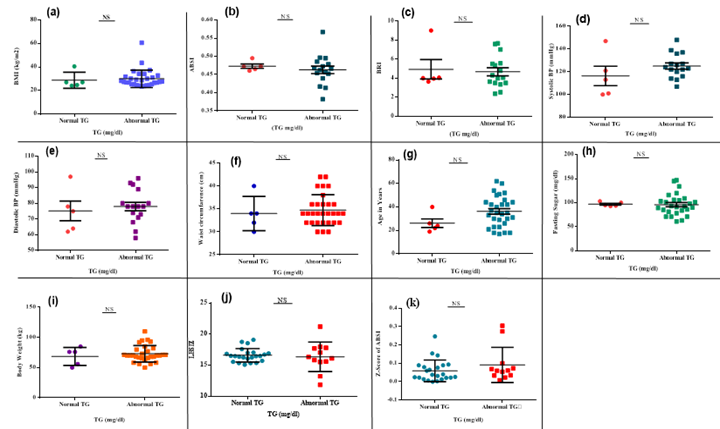
Figure 9: Anthropometric and metabolic parameters in the assessment of TG. Scattered-plot represent the values for different metabolic and anthropometric parameters in subgroups of TG classified into (abnormal and normal TG). (a): BMI and severity of TG level, (b): ABSI relation with TG, (c): BRI relation with TG, (d): Systolic BP relation with TG level, (e): Diastolic relation with TG, (f): WC relation with TG, (g): Effect of age on the severity of TG, (h): Fasting sugar relation with TG, (i): body weight relation with TG, (j): LBSIZ relation with TG, (k): Relation of Z-score of ABSI and TG. NS represented non-significant values
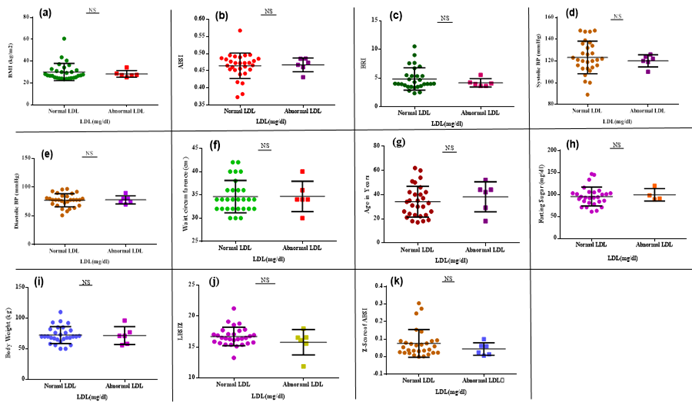
Figure 10: Anthropometric and metabolic parameters in the assessment of LDL. Scattered plots represent the values for different metabolic and anthropometric parameters in subgroups of LDL classified into (abnormal and normal LDL). (a): BMI and severity of LDL level, (b): ABSI relation with LDL, (c): BRI relation with LDL, (d): Systolic BP relation with LDL level, (e): Diastolic relation with LDL, (f): WC relation with LDL, (g): Effect of age on the severity of LDL, (h): Fasting sugar relation with LDL, (i): Body weight relation with LDL, (j): LBSIZ relation with LDL, (k): Relation of Z-score of ABSI and LDL. NS represented non-significant values.
LDL
In the studied population, different anthropometric and metabolic parameters between subgroups of LDL (normal and abnormal LDL) were compared. Overall non-significant difference was observed, the participants having abnormal LDL levels showed higher values for all anthropometric and metabolic parameters in the studied population except BMI, BRI, systolic BP, LBSIZ, and Z-score of ABSI is shown in Figure 10.
DISCUSSION
Population study has great importance to monitor risk factors of certain diseases as dyslipidemia and coronary heart disease. But, in Pakistan, there are few population-based studies related to lipid levels. About 80.9 % of the Iranian population while 79% Indian adults have reported dyslipidemia [29]. In Pakistan, 63% population was marked as dyslipidaemic [18], but very few cross-sectional studies of Pakistani population have been published. In this study, the lipid profiles of specialized urban and rural populations were investigated to assess their relation to the onset of coronary heart disease. The disturbance in average plasma lipoprotein levels mainly leads to CHD. In this study, the lipoprotein profile of 80 subjects was assessed, where 89% of subjects showed abnormalities in at least one lipid fraction including TC, TG, and HDL as mentioned in a previously reported study [18]. The most usual form of dyslipidemia is low HDL followed by high TG and 77% of subjects of this study have low HDL and 36% have high TG having a high risk for CHD. Secondly, the link between BMI and obesity was assessed among these subjects and it was observed that 61% of subjects had abnormal BMI. But BMI has serval limitations and it is not a strong indicator for dyslipidemia [30]. So, the lipid fractions (TC, TG, HDL, and LDL) relation was classified as rural and urban populations where a non-significant difference was observed. Where the rural population had abnormal values of HDL and TG, and classified dyslipidemic. While a gender-based lipoprotein profile comparison also showed a non-significant difference, however, average number of both genders were observed to have abnormal levels of HDL and TG. Moreover, it was also observed that as compared to females, males have high levels of TG and are marked as dyslipidemic having a high risk for dyslipidemia and CHD [31].
Dyslipidemia and socioeconomic status have great relevance [32], as it found that CHD mortality and morbidity are more prevalent in low-income classes. It is documented that between all lipid fractions, low HDL is constantly linked with low socioeconomic status [33]. The analysis of the relation of plasma lipid fractions with major two classes of occupation (blue-collar and white-collar), observed that blue-collar showed abnormal levels of HDL and white-collar showed abnormal levels of TG, TC, and LDL. The analysis of lipid fractions in the severity of dyslipidemia was performed for the assessment of numerous metabolic and anthropometric parameters. Where the abnormal contributors (showing abnormality within the plasma levels of at least one of the main fractions of lipoprotein) were correlated with normal participants, non-significant variances were detected for all calculated anthropometric parameters. Next, we determined the impact of various degrees and categories of dyslipidemia on the respective parameters. The subjects having abnormal plasma HDL levels participants showed non-significantly higher values for systolic BP, diastolic BP, BMI, and LBSIZ, while the remaining metabolic/ anthropometric parameters showed lower values. However, the subjects having abnormal plasma TC showed non-significantly high values for almost all parameters except BMI and BRI. Whereas the subjects having abnormal plasma TG levels showed lower values for ABSI and BRI. Lastly, the subjects having abnormal plasma LDL levels showed lower values for BMI, BRI, systolic BP, and LBSIZ.
In addition to these assessments, the link between LBSIZ and the risk of CVD in the current population is also investigated. Higher values of BMI and WC were connected with an increased risk of CVD. However, the existing literature clearly correlates that BMI and WC have numerous limitations for the assessment of CVD [34]. To overcome these limitations new indices like ABSI and BRI were introduced. Currently, the z-score of log-transformed ABSI (LBSIZ) has been introduced for the improvement of ABSI. The previous studies explained that LBSIZ is a standard stabilized obesity measure, independent of weight, height, and BMI as the higher values of LBSIZ are more associated with CVD [35]. In this study, the link between lipoprotein fraction and LBSIZ was observed, and the average value of LBSIZ was high only in abnormal HDL and had a strong association with CVD. The link between the Z-score of ABSI and lipoprotein fractions was also assessed, it highlighted the abnormal HDL, LDL, and TC showed lower values for the Z-score of ABSI while abnormal TG showed higher values for the Z-score of ABSI.
CONCLUSION
Dyslipidemia is an abnormality of any lipoprotein fraction such as total cholesterol (TC), triglycerides (TG), low-density lipoproteins (LDL), and high-density lipoproteins (HDL). In this study, the rural population and male subjects were classified as dyslipidemic because they had abnormal lipid profiles. The studied population showed abnormalities in at least one lipid fraction including TC, LDL, TG and HDL, where 89% of the subjects were classified as dyslipidemic. The most common form of dyslipidemia was low HDL (77%) followed by high TG (36%). Various anthropometric and metabolic parameters traditionally used in the severity of dyslipidemia but they were not strong predictors of dyslipidemia. Therefore, newly introduced anthropometric parameters LBSIZ and Z-score of ABSI were used to assess the dyslipidemia, but they were not proven to be strong predictors of dyslipidemia in this study.
REFERENCES
*Correspondence: mshoaibkhan015@gmail.com
[1]Department of Life Sciences, University of Management and Technology, Lahore, Pakistan