Role of Newly Designed Anthropometric Parameters in Assessment of Gonadotropic Hormones and Lipid Fractions in Females
Faiza Quddus[1]*, Ahmed Sultan[2], Muhammad Shoaib[3]
|
KEYWORDS Anthropometric parameters, BMI, WC, ABSI, BRI, VAI, FSH/LH, Gonadotropic hormones, Sex hormones, Lipid fraction |
|
ABSTRACT This study investigated the predictive capabilities of newly designed anthropometric indices (Body Shape Index [ABSI], Body Roundness Index [BRI], and Visceral Adiposity Index [VAI]) for identifying abnormal levels of gonadotropic hormones (Follicle Stimulating Hormone [FSH] and Luteinizing Hormone [LH]) and abnormal lipid profiles in 289 females residing in the Lahore area. FSH and LH levels were measured using commercially available kits employing the chemiluminescent microparticle immunoassay (CMIA). The lipid profile (i.e., Total cholesterol [TC], Triglyceride [TG], and High-density lipoprotein cholesterol [HDL-C]) was assessed using the colorimetric method, while Low-Density Lipoprotein Cholesterol (LDL-C) was calculated mathematically. Standardized formulas were used to calculate the anthropometric indices (ABSI, BRI, and VAI) based on weight (kg), height (m), and waist circumference (cm). The results revealed that low HDL-C levels constituted the most common lipid abnormality within the studied population. The trends of ABSI, BRI, and VAI did not exhibit significant differences between FSH and LH-based groups. Additionally, non-significant results and receiver operating characteristic (ROC) curve analysis confirmed weak predictive capabilities for identifying abnormal FSH and LH levels. This study concludes that ABSI, BRI, and VAI are not strong predictors of abnormal gonadotropic hormone levels. |
INTRODUCTION
Gonadotropic hormones specifically follicle-stimulating hormone (FSH) and luteinizing hormone (LH) play a significant role in the female reproductive cycle. Elevated levels of FSH and LH can lead to several health problems in women. Previous studies have demonstrated that hypergonadotropic women are at increased risk of bone loss and osteoporosis. Moreover, a high level of FSH has been shown to promote fat accumulation by regulating the genes involved in lipogenesis. Hypergonadotropic women, often in their post-menopausal period, are more susceptible to obesity and dyslipidemia [1]. Previous work primarily focused on the association of adiposity and dyslipidemia with body mass index (BMI) and waist circumference (WC). While BMI has historically been recommended as a key index for the estimation of dyslipidemia, it has now been established that BMI has limitations accurately assessing body fatness. This is because BMI does not consider factors related to body size and abdominal obesity, which can significantly influence lipid profile [2]. Reports indicate that BMI fails to differentiate between weight associated with increased muscles and uneven excess fat accumulation. Recent studies have demonstrated that WC is a superior anthropometric index for measuring visceral adipose tissues and predicting cardiovascular (CVD) risk compared to both BMI and waist-to-hip ratio [3]. Further research has shown that central obesity, as measured by WC, is more closely associated with CVD risk in women. Additionally, partial correlation analysis confirms the utility of WC in assessing both general and central obesity, making it more accurate indicator of cardiovascular disease risk in women compared to other anthropometric measures [4]. WC depends on various factors including body size (weight and height), fat percentage and fat distribution. However, disentangling the specific contribution of body size to WC remains challenging. Additionally, WC is a single value and lack relative ratios for physique, limiting its reliability as a sole indicator of health risks. These limitations necessitate the development of new parameters that combine classical indices like height, weight, WC, and BMI, potentially leading to improved prediction of obesity. For abdominal obesity, WC remains a key indicator and has been associated with non-communicable diseases. Excess of waist circumference has also been reported to be associated with increased prevalence of cardiovascular disease. Two new parameters have been developed, demonstrating a strong correlation with abdominal fat accumulation. A recent study introduced the body shape index (ABSI), which is calculated based on waist circumference (m), height (m) and BMI (kg/m2). ABSI can be used in the assessment of diabetes mellitus and health condition in females.
However, some studies have reported controversial results, suggesting that ABSI is a weak index for assessing CVD risk and identifying metabolic syndromes [5]. Another new geometric index, the Body roundness index (BRI), can be calculated by using height (m) and waist circumference (m). Studies have shown that BRI is a better predictor of fat than existing indices, and it is considered as a better predictive index for diabetes mellitus compared to ABSI and BMI [6]. In addition to the BRI, the Visceral Adiposity Index (VAI) is another recently introduced index for assessing visceral fat. VAI incorporates WC & BMI alongside two biochemical factors including triglycerides (TG) and high-density lipoprotein (HDL) [7]. As a surrogate marker for adipose tissue distribution, VAI has been employed in the analysis of insulin sensitivity and serves as a marker for cardiometabolic risk assessment [8]. One study investigated an obese secondary infertile group of women and found statistical significant increase in the the FSH/LH ratio and serum prolactin levels [9].
This study aims to investigate the association between gonadotropin levels (FSH and LH) and anthropometric parameters, including, including classical indices (BMI, BF% and BFM) and newly designed indices (ABSI, BRI and VAI), in females residing in urban and rural areas. This study also compared the predictive capabilities of these classical and newly designed parameters for the identification of gonadotropic level under the significance of newly described parameters (ABSI, BRI, and VAI).
METHODOLOGY
In this cross-sectional study design, the data of 289 females was taken from the Chughtai’s lab Lahore during the period of one year from February 2019 to January 2020. The study participants were above the age 12. The study protocols were executed according to Helsinki Declaration. The presented work was also approved by the Ethical Review Board of School of Science, University of Management and Technology, Lahore. All the study participants with any bacterial/viral infection, any type of cancer, bleeding disorders (hemophilia, low level of platelets) and diabetes mellitus were excluded from the study. The statin users and individuals on anticoagulation therapy were also excluded to avoid the interference of these conditions with plasma lipid levels. Informed consent was taken from each participant before sample collection. For age-related analysis, the study population was stratified into the following age groups: Group 1 (12-19 years), Group 2 (20-27 years), Group 3 (28-35 years), Group 4 (36-43 years), Group 5 (44-51 years), Group 6 (52-59 years) and Group 7 (≥60 years).
Assessment of Classical and Newly Designed Anthropometric Parameters
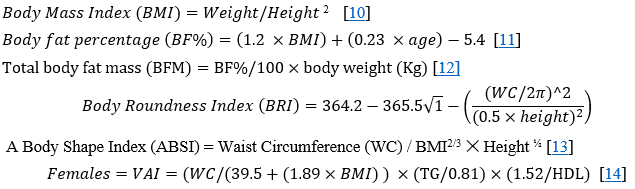
Anthropometric parameters including weight, height, and waist circumference were measured from study participants. A standard weighing scale to the nearest kilograms was used to measure body weight. A non-stretchable measuring tape was used to measure height and waist circumference to the nearest 0.5cm. At minimal respiration, WC was measured in between iliac crests and costal margins and at the widest point of buttock muscles. All these measurements were taken with participants wearing light clothes, without footwear and accessories. Classical anthropometric parameters, including Body mass index (BMI), Body fat percentage (BF%), Body fat mass, and newly designed anthropometric parameters including Body roundness index (BRI), A body shape index (ABSI), and Visceral adiposity index (VAI) were calculated using standardized formulas:
Blood Sample Collection and Measurement of Different Parameters
Statistical Analysis
For data analysis, student’s t test was applied using Graph-Pad Prism Software. All results with p-values less than 0.005 were considered statistically significant. One-way ANOVA was used to analyze the trend of FSH and LH in different groups of study population. Pearson’s correlation coefficients were used to find the correlation between multiple newly designed and classical anthropometric parameters with gonadotropic hormones (FSH & LH). The area under receiver operating characteristics (ROC) curves was calculated to evaluate the discriminative power of any anthropometric parameter for identifying abnormal gonadotropic hormone levels.
RESULTS
Stratification of Study Population Based on Lipid Fractions
The study population was stratified into different categories based on their plasma lipid fractions, as shown in Figure 1. Over 60% of the population exhibited desirable levels of TG (Figure 1a) and TC (Figure 1c). In contrast, only 53% of the population displayed normal levels of LDL-C (Figure 1b). Notable, less than 30% of the population had borderline high TG, LDL-C, and TC values. Elevated levels of these lipid fractions are known to increase the risk of CVD. Conversely, due to low plasma levels of LDL-C and TG, less than 20% of the population was categorized as having a high risk for CVD. While 9% of the study population exhibited a high level of TC leading to abnormal lipid profile and increasing chances for CVD. HDL-C, is also known as a good cholesterol, exhibits an inverse relationship with abnormal lipid profile. of the risk of CVD decreases when HDL-C levels are high. In this population, only 9% of the individuals had high HDL-C levels, placing them in a lower risk group for CVD. Conversely, 33% of the population exhibited lower HDL-C levels, contributing to an abnormal lipid profile. This analysis reveals that the most prevalent type of lipid abnormality in this population is low HDL-C levels.
The Trend of Gonadotropic Hormones on the Basis of HDL-C Level in Plasma
Firstly, the study population was categorized into three groups based on their HDL-C levels according to ATP III guidelines: low (less than 40 mg/dL), desirable (40-60 mg/Dl), and high (greater than 60 mg/dL). Participants with HDL-C levels within desirable range were considered as a separate group, while the remaining two groups were classified as undesirable. Gonadotropic hormones (FSH and LH) levels were analyzed in these HDL-C based groups of the study population. An increasing trend in FSH levels was observed with increasing HDL-C value. Participants with higher HDL-C values (>60 mg/dL) displayed higher FSH levels, while those with lower HDL-C (<40 mg/dL) and an increased risk of CVD exhibited lower FSH levels (Figure 2a). The group with desirable HDL-C levels (40-60 mg/dL) had FSH levels intermediate between the other two groups. A similar trend was observed for LH, with lower levels found in the low HDL-C groups and elevated level in high HDL-C group (Figure 2b). ANOVA analysis revealed statistically significant difference in both FSH and LH levels among the HDL-C groups.
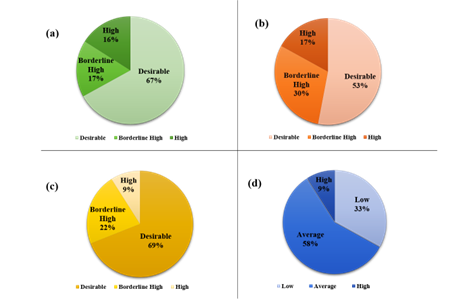
Figure 1. Pie charts representing percentages of the study population into different sub-groups by different plasma lipid fractions. (a) Triglyceride (b) Low-density lipoprotein cholesterol (LDL-C) (c) Total cholesterol (TC) (d) High-density lipoprotein cholesterol (HDL-C)
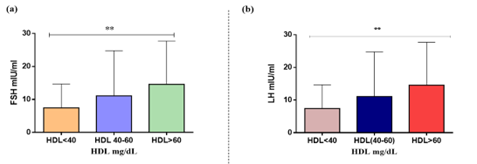
Figure 2. Comparison of gonadotropic hormones with different HDL-C based groups of the study population. (a) Comparison of FSH with HDL-C based groups. (b) Comparison of Luteinizing hormone with HDL-C based groups. Significance was determined by ANOVA. **Significant difference (P<0.05)
Classical Anthropometry
The trend of different classical anthropometric parameters (BF%, BMI and BFM) among study groups, classified according to gonadotropic hormones (FSH and LH) levels, as shown in Figure 3. BF% values were nearly identical across both FSH groups, with a slight increase observed in the higher FSH group. No statistical difference was found between the BF% of normal and higher LH groups. Similarly, the BMI trend showed no distinction between FSH and LH groups, as values remained consistent acrossboth groups. Consequently, paired-t test analysis revealed no statistically significant in BMI concerning both FSH & LH. The trend for Total Body Fat Mass (BFM) demonstraed higher BFM in the group with higher FSH and lower BFM in the group with normal FSH, and there was a statistically significant difference between BFM and FSH. In contrast, LH levels remained similar across both study groups, with no statistically significant difference detected by paired t-test.
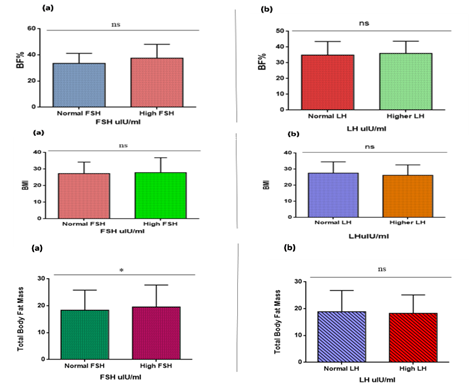
Figure 3. Trend of classical anthropometric index (BF%, BMI and BFM) with gonadotropic hormones (FSH and LH) in form of bar graph. (a) The bar graph represents the comparison between classical anthropometric indices and follicle stimulating hormone (FSH) among different groups in study population. (b) The bar graph represents the comparison between classical anthropometric indices and luteinizing hormone (LH) among different groups in study population. Significance was determined by t-test (paired). ns Significant difference (P<0.05)
Newly Designed Anthropometric Parameters
The study population was divided into two groups based on gonadotropic hormones (FSH & LH) levels: normal and elevated. Trends in several newly designed anthropometric parameters (ABSI, BRI and VAI) were analyzed across these groups. No significant difference in ABSI values was observed in normal and elevated FSH groups. A similar trend was observed in LH groups. BRI values were slightly higher in elevated FSH group compared to the normal FSH group, although the paired t-test revealed no statistically significant difference between their values. Moreover, the BRI trend remained consistent across both LH groups, without any statistically significant difference. Visceral adiposity index values were slightly higher in both normal FSH and LH groups compared to elevated and FSH and LH groups. However, the paired t-test showed no statistically significant difference between both groups for either FSH and LH.
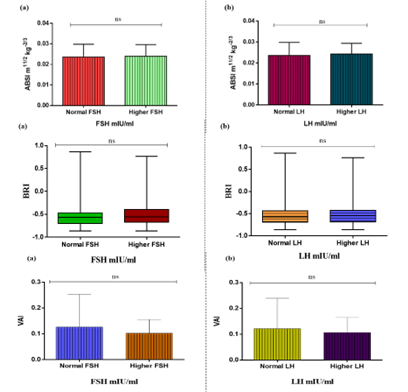
Figure 4. Trend of newly designed anthropometric parameters (ABSI, BRI and VAI) with gonadotropic hormones (FSH and LH) in form of bar graph. (a) The bar graph represents the comparison between newly designed anthropometric indices and follicle stimulating hormone (FSH) among different groups in study population. (b) The bar graph represents the comparison between newly designed anthropometric indices and luteinizing hormone (LH) among different groups in study population. Significance was determined by t-test (paired). ns Significant difference (P<0.05)
Correlation of Various Anthropometric Parameters with Gonadotropic Hormones and Plasma Lipid Levels
Correlation of various classical and newly designed anthropometric parameters were analyzed along with gonadotropic hormones and plasma lipid levels (Table 1). BMI showed a positive and weak correlation with FSH, and a negative and weak correlation with LH. Other classical anthropometric parameters (BF% and BFM) showed a positive and weak correlation with LH and FSH, while BRI showed an inverse and weak correlation with hormone levels including FSH and LH. ABSI showed a very weak but positive correlation with FSH and LH. On the other hand, a negative but not-so-strong correlation was present between VAI and gonadotropic hormones (FSH and LH)
BMI showed a weak but positive correlation with plasma lipid levels including LDL-C, HDL-C, TC, and TG. As far as the correlation of BF% and BFM with plasma lipid levels is concerned, it was determined that a positive and weak correlation was seen among them. In the case of newly designed parameters, there was also a negative correlation between BRI and Plasma lipid fractions including LDL-C, TG, and TC while a very weak but positive correlation was present in BRI and HDL-C. ABSI showed a negative weak correlation with LDL-C, HDL-C, TG, and TC. In the case of VAI, there was a strong positive correlation between VAI with TG and a very weak but direct correlation with LDL-C level as shown in Table 1.
Predictive Capabilities of Anthropometric Parameters for the Levels of Gonadotropic Hormones
Receiver operating characteristic (ROC) curve analysis was performed to assess the predictive capabilities of anthropometric indices (Classical and newly designed), to estimate the level of gonadotropic hormones (FSH and LH). For FSH, BF% displayed the highest area under the curve (AUC) value of 0.58, placing it in the category of a weak predictor for hormonal levels. BMI and BFM exhibited values of 0.50 and 0.54, respectively, also falling into the category of weak predictors. Similarly, when assessing the LH, BF% again showed the highest area under the curve value of 0.54, classifying it as a weak predictor. BMI and BFM demonstrated even weaker predictive capabilities, with AUC values of 0.45 and 0.49, respectively. In case of LH, ABSI yielded the highest AUC value of 0.56, but this falls within the category of a weak parameter for predicting hormone levels. BRI and VAI also displayed similar weak predictive capabilities, with AUC values of 0.51. When assessing FSH, both
Table 1. Pearson’s correlation coefficients for lipid fractions, gonadotropin hormones, and anthropometric indices
|
Parameters |
BMI |
BF% |
BFM |
BRI |
ABSI |
VAI |
|
FSH (mIU/ml) |
0.036799 |
0.145372 |
0.081482 |
0.088414 |
0.023223 |
-0.08612 |
|
LH (mIU/ml) |
-0.12547 |
-0.026 |
-0.07536 |
-0.01365 |
0.112776 |
-0.0346 |
|
HDL-C (mg/dL) |
0.035248 |
0.062081 |
0.054902 |
0.018003 |
-0.01743 |
-0.44128 |
|
LDL-C (mg/dL) |
0.130081 |
0.157865 |
0.166943 |
-0.0361 |
-0.15565 |
0.03161 |
|
TG (mg/dL) |
0.004385 |
0.023123 |
0.006383 |
-0.01531 |
-0.03236 |
0.87011 |
|
TC (mg/dL) |
0.117452 |
0.156124 |
0.149789 |
-0.01878 |
-0.13521 |
0.176498 |
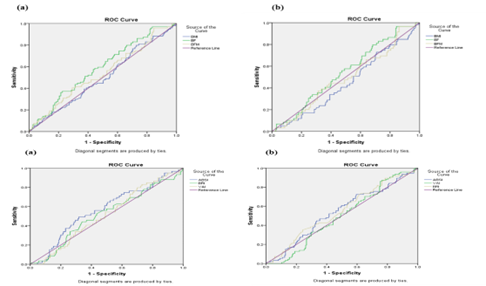
Figure 5. The area under the Receiver Operating Characteristic curve of classical and newly designed anthropometric parameters to identify their predictive capabilities for the measurement of gonadotropic hormones (FSH & LH)
ABSI and BRI give exhibited weak but similar AUC values of 0.54, while VAI had the lowest AUC value of 0.49. These findings demonstrate that none of the investigated anthropometric parameters possess strong predictive capabilities for the estimating gonadotropin hormonal levels.
DISCUSSION
This study aimed to investigate the association between gonadotropic hormones (FSH and LH) and anthropometric parameters, including classical indices (BMI, BF%, and BFM) and newly designed indices (ABSI, BRI, and VAI), in females residing in urban and rural areas. The study also compared the predictive capabilities of these classical and newly designed parameters for identifying gonadotropin levels and discussed the significance of the newly described parameters (ABSI, BRI, and VAI). Our initial analysis focussed on stratifying the study population into groups based on their lipid fractions to identify the most prevalent abnormal lipid fraction. This analysis revealed that low HDL-C levels constituted the most common type of lipid abnormality in the study population, followed by elevated levels of LDL-C and triglyceride levels. Elevated total cholesterol levels were the least prevalent abnormality. These findings align with previously reported studies, demonstrating a similar trend in women. Next, the trend of gonadotropic hormones (FSH and LH) was analysed in different groups of the study population based on HDL-C levels according to ATP III guidelines. A statistically significant difference (p< 0.05) in FSH and LH values was observed across these groups. Strikingly, FSH and LH increased with increasing levels of HDL-C, indicating a direct relationship between the two parameters. These findings are consistent with previous research, where higher FSH levels were associated with a somewhat lower risk of abnormal HDL-C levels [15](Serviente, 2019 #62).
Similarly, a second study in postmenopausal Chinese women demonstrated a direct association between FSH and HDL-C [16]. Additionally, recent experimental work found significant differences between women with hyperandrogenic PCOS and those without, with hyperandrogenic PCOS patients exhibiting lower HDL-C, higher LDL-C, and higher BMI. Furthermore, another study established an association between increased FSH and LH levels with increased HDL levels, indicating a lower risk of coronary artery disease in women with higher levels of these gonadotropic hormones compared to men. Fluctuation in HDL levels observed during various phases of the menstrual cycle further support the role of gonadotropins in lipoprotein regulation. These findings, in conjunction with our data, suggest a potential protective role of gonadotropins on arterial vessels. However, the exact mechanism of action of FSH and LH remains unknown. One possible explanation is that FSH and LH levels influence hepatic lipase activity, leading to changes in HDL levels and its subclasses [17].
Moreover, the trend of the newly designed anthropometric parameter (ABSI) was observed in different groups of the study population based on FSH and LH cut-off values. Notably, no statistically significant difference was observed in ABSI values between both groups. ABSI, which is calculated based on WC, BMI, and height, indicates high WC for a given weight and height. Interestingly, studies examining individual parameters within the ABSI formula have yielded inconsistent results. Some have reported a positive correlation between FSH and LH and WC [18], while others have found an inverse relationship [19]. Similarly, an inverse relationship has been observed between LH and BMI in normally menstruating women, with a similar trend seen for FSH [20]. However, in our results, the ABSI trend remained consistent across both normal and abnormal values of FSH and LH-based groups. This suggests that the formula of ABSI, being a ratio of different indices, might lack the sensitivity to predict gonadotropin levels effectively. This hypothesis is further supported by previous studies where ABSI failed to reliably determine the health status of adolescents. In another study, standardized WC for BMI and height by adding 2/3 and ½ in the denominator, respectively, rendering ABSI non-correlated to BMI. Yet, the same study suggested that ABSI could serve as a better health indicator if hip circumference was incorporated along with WC, weight, and height [21].
Another newly described anthropometric index, BRI was employed to assess its effectiveness in determining the gonadotropin hormones levels [22]. The results demonstrated that BRI values were slightly higher in the high-FSH group, although the difference was not statistically significant. Conversely, BRI values remained consistent across both LH-based groups. This lack of variation indicates that BRI is not suitable for monitoring FSH and LH levels [23]. Comparing the predictive capability of BRI for other diseases like metabolic syndrome, type 2 diabetes, insulin resistance, and inflammatory factors revealed that its performance was not superior to classical parameters such as WC and WHtR [24]. Moreover, inconsistencies in BRI cut-off points for men and women across different studies highlight potential population, race, and diagnostic criteria variations in metabolic syndrome determination [25]. Literature suggests that incorporating hip circumference into the BRI formula can improve its performance for the predicting various diseases [26]. In this study, BRI’s inability to measure FSH and LH levels might be attributed to its formula lacking hip circumference and relying solely on ratios of classical anthropometric parameters.
To investigate the relationship between visceral adiposity index (VAI) and gonadotropic hormone levels, the study population was divided into two groups based on FSH and LH levels. While an inverse relation between VAI and both FSH and LH was observed, of the differences in VAI values between the two groups were not statistically significant. VAI serves as a measure of visceral adipose tissues and its dysfunction. Existing literature supports the notion that visceral adipose tissues releases increased amounts of oestrogen [22]. To assess the influence of age on gonadotropin hormone levels, the study population was further divided into distinct age groups ranging from 12 to 66 years. This study revealed an age related increase in FSH and LH levels, with the highest levels observed in age group 5 (44-51 years) and an even further increase in age group 6 (52-59 years) [27]. These findings align with previous research, demonstrating an increase in FSH only in women above 46 years of age [27], while another study reported an increase in FSH only in women above age 40 [28]. Additionally, another study observed an increased LH concentration in women above 48 years of age [29]. One potential explanation for this age-related rise in gonadotropic hormone secretion is in the accelerating rate of follicular depletion, leading to a decreased ovarian follicle count [30]. Pearson correlation coefficient analysis was performed to investigate the monotonic relationship between anthropometric parameters, gonadotropic hormones (FSH and LH), and lipid fractions in female plasma. The results revealed negligible correlations (r= 0.01-0.1) between the anthropometric parameters (BRI, ABSI, and VAI) and both tested lipid fractions (LDL, HDL, TG, and TC) and gonadotropin hormones. Notably, the results for ABSI aligned with a previous study, where ABSI showed a very weak and negative correlation (r= -0.04) with HDL and a very weak but positive correlation (r= 0.021) with LDL. However, inconsistencies were observed for BRI in comparison to existing research [31].
Receiver operator characteristic (ROC) curve analysis was performed to assess the diagnostic power of newly designed anthropometric indices (ABSI, BRI, and VAI) for measuring gonadotropic hormones (FSH and LH) levels. The area under the ROC curve (AUC) is a measure of a diagnostic test’s discriminatory power. An AUC of 1 represents a perfect test (100% specificity and sensitivity), while 0.5 indicates a non-discriminatory test (50% specificity and sensitivity), represented by a straight line. Clinically AUC ≤ 0.75 is considered not useful while AUC ≥ 0.97 is considered highly useful. The results revealed that the predictive capabilities of anthropometric indices (ABSI, BRI, and VAI) were not clinically useful for measuring both FSH and LH levels, as determined by AUC. For LH, the AUC values for ABSI, BRI, and VAI were 0.56, 0.51, and 0.50, respectively. In the case of FSH, both ABSI and BRI had the same AUC value of 0.54, while VAI displayed the weakest predictive capability with an AUC value of 0.49. Our finding of an AUC of 0.56 for ABSI aligns with a previous study where an AUC of 0.57 for ABSI was deemed insufficient for identifying cardiovascular disease (CVD) and CVD risk factors in 2014. Similarly, another study reported an AUC of 0.58 for BRI, indicating that BRI was not superior to BMI in predicting CVD. Our study’s AUC value of 0.54 for BRI is consistent with this finding. These findings suggest potential implications for associating the relationships between newly designed anthropometric parameters and gonadotrophic hormones. Further large-scale experimental work is required to investigate the correlation of HDL and LDL with these newly designed anthropometric parameters.
CONCLUSION
Based on the presented data, it can be concluded that abnormal gonadotropic hormone levels cannot be reliably detected using the newly designed anthropometric parameters ABSI, BRI, and VAI. The AUC analysis further confirms this finding, demonstrating that these parameters are not effective in accurately measuring FSH and LH levels.
REFERENCES
*Correspondence: faizaquddus13@gmail.com
[1]Centre of Excellence in Molecular Biology, University of the Punjab, Lahore, Pakistan
[2]Department of Biological Sciences, Superior University Lahore, Pakistan
[3]Department of Life Sciences, University of Management and Technology, Lahore, Pakistan